Custom visual types
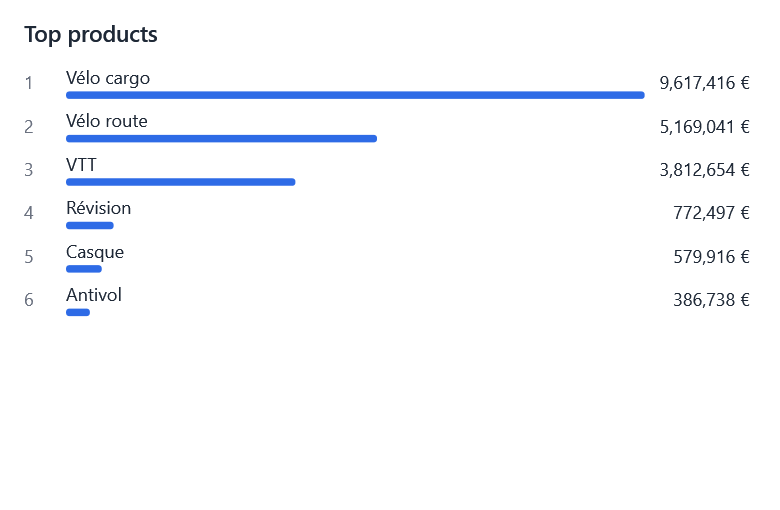
A visual type is a VisualType (an id) and its VisualTypeDefinition: its name, its section of the designer's gallery,
the fields each well takes, its tooltips, its settings and its rules. EasyBI's own types (VisualType.Bar,
VisualType.Pie...) are defined the same way, in the context's catalog (EasyBIContext.VisualTypes), so a type of the
application goes through the same paths: the gallery, the wells, the properties panel, the validation, the fields
dropped on a dashboard, cross-filtering and tooltips.
Declaring a type
public static class BusinessTypes
{
    public static readonly VisualType Treemap = new("barista.treemap");

    public static VisualTypeDefinition TreemapDefinition { get; } = new(Treemap, () => Texts.Treemap)
    {
        Group = VisualTypeGroup.Composition,                          // section of the gallery; null: not offered
        Axis = new() { MinFields = 1, MaxFields = 2, Caption = () => Texts.Groups },
        Legend = VisualWell.Unused,
        Values = new() { MinFields = 1, MaxFields = 1, Caption = () => Texts.Size },
        HasTooltips = true,                                           // the tooltip well, and its measures queried
        Format = FormatTarget.Chart,                                  // the format settings of its values
        Options = [RendererOption.Toggle("labels", () => Texts.ShowLabels, @default: true)],
        Validate = v => v.Top is > 50 ? Texts.TooManyRectangles : null,
    };
}

var context = EasyBIContext.Create()
    .AddModel(sales)
    .AddVisualType(BusinessTypes.TreemapDefinition)
    .UseRenderer(new LiveCharts2Renderer())
    .UseRenderer(new TreemapRenderer());
- The id has a prefix (
barista.treemap), so that it never takes the name of a type EasyBI adds later:AddVisualTyperefuses an id without one. The id is what the report saves ("type": "barista.treemap"): keep it stable. - Captions are functions, read each time, so that they follow the language of EasyBI (see Localization).
- Wells:
IsUsed(a well the type does not use refuses fields),MinFields,MaxFields(null: no limit) and the name the designer gives the well (null: Axis, Legend or Values). The designer refuses a field beyondMaxFields, and the visual tells what is missing or too much. By default a type takes up to three axis fields, one legend and at least one measure. Validateis a rule of the type, checked before the wells, so that its message, more precise, comes first.Optionsare settings of the type, shown in the Options section of the properties panel whatever the renderer drawing it, and saved in the visual'sExtensionsunder the type's id. The renderer reads them withvisual.GetTypeOption<bool>("labels", true).
Drawing it
A renderer draws the type when its capabilities list it, like any type (see Writing a connector). It
receives the usual RenderRequest: the query result (Result) and the pivoted data (Chart: one category per axis
value, one series per measure and legend value). It reports clicks with request.Select(new CategorySelection(...)),
which cross-filters the other visuals, and shows tooltips with request.TooltipFor(category, series).
public sealed class TreemapRenderer : IVisualRenderer
{
    public string Name => "Treemap";

    public RendererCapabilities Capabilities { get; } = new(new HashSet<VisualType> { BusinessTypes.Treemap })
    {
        // Optional: declared with the renderer, so that plugging it in is enough
        VisualTypes = [BusinessTypes.TreemapDefinition],
    };

    public FrameworkElement Render(RenderRequest request) => new TreemapView(request);
}
When the renderer lists the definition in VisualTypes, UseRenderer declares the type, unless the catalog already
has it: a library of visuals is plugged in with one call. The sample application's RankingRenderer is a complete
example: a ranking of a dimension's items by a measure, with a setting, its icon, cross-filtering and tooltips. Without a renderer for it, the type is greyed in the gallery,
and its visuals say that no renderer draws them.
Its icon
The gallery shows the icon of a type from the resources: a Geometry drawn with the foreground in a 16×16 box, under
the key of the type. Without one, the type shows a default icon. The same key replaces the icon of one of EasyBI's
types.
<Application.Resources>
    <Geometry x:Key="{bi:VisualTypeIconKey barista.treemap}">M1.5,1.5 H9 V14.5 H1.5 Z M10,1.5 H14.5 V8 H10 Z M10,9 H14.5 V14.5 H10 Z</Geometry>
    <Geometry x:Key="{bi:VisualTypeIconKey Bar}">M2,14 V6 M6,14 V2 M10,14 V8 M14,14 V4</Geometry>
</Application.Resources>
In code, the key is VisualTypeIcons.KeyOf(type).
Changing EasyBI's types
The catalog of the context changes EasyBI's types too, before the designer shows:
var types = context.VisualTypes;
types.Hide(VisualType.Waterfall);                                     // out of the gallery; its visuals still show
types.Replace(types.Get(VisualType.Bar) with { Caption = () => Texts.Columns });
Keep only a few types
Hide every other type of the gallery, after the renderers are plugged in (a renderer may bring types of its own):
VisualType[] kept = [VisualType.Bar, VisualType.Line, VisualType.Pie];
foreach (var type in context.VisualTypes.Definitions
             .Where(d => d.Group is not null && !kept.Contains(d.Type))
             .Select(d => d.Type).ToList())   // Hide changes the catalog being read
    context.VisualTypes.Hide(type);
For a single designer, a rule greys the other types instead.
A report written by another application can hold a type this one does not declare: it opens, and the visual says that no renderer draws it.
What a type cannot do yet
- Have other wells than Axis, Legend and Values (a size and a color, for instance).
- Show its own content without querying a model, like the text and image visuals.
- Get its data in another shape than the result and the pivoted chart data: a renderer needing another shape builds it
from
request.Result.