Cross-filtering
A click on a bar, a point, a slice or a row filters the other visuals of the dashboard on what it shows. Below, the Île-de-France / Partenaires bar is clicked: its visual dims the rest and shows the selection, and the revenue by quarter now counts those sales only.
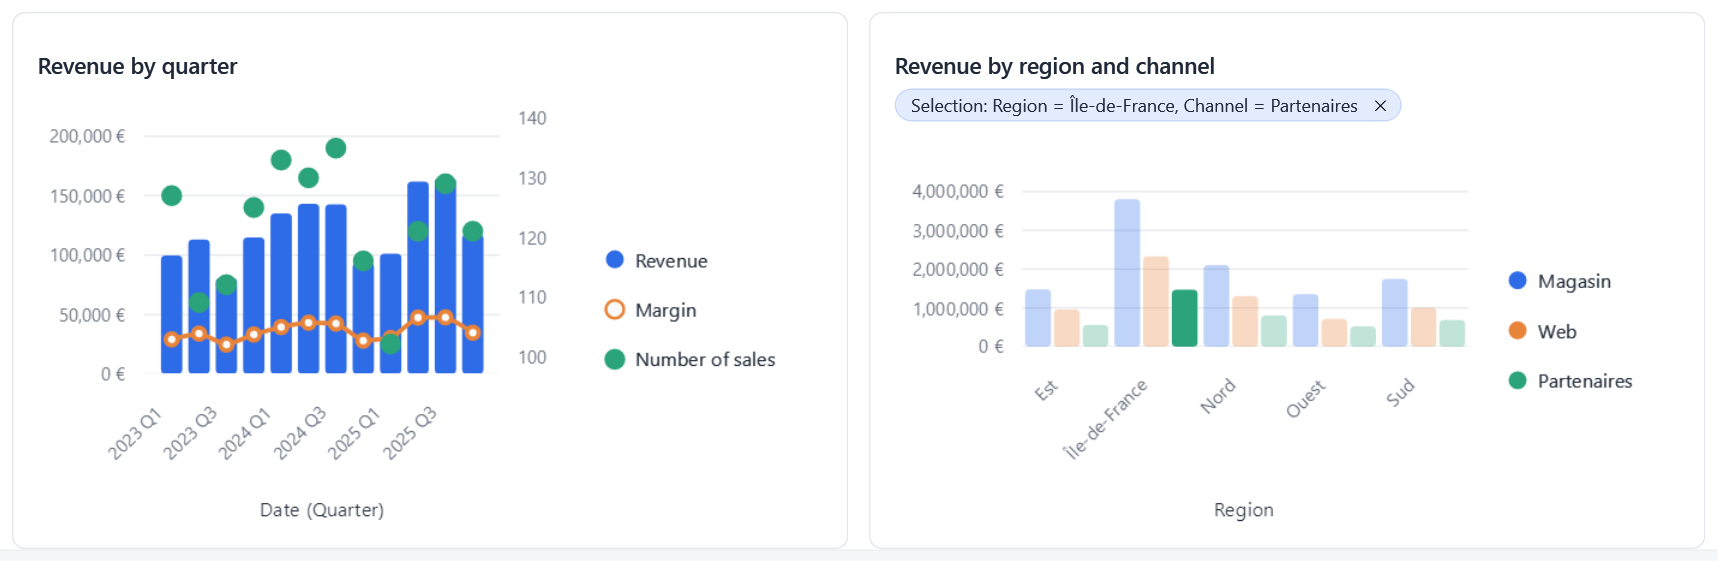
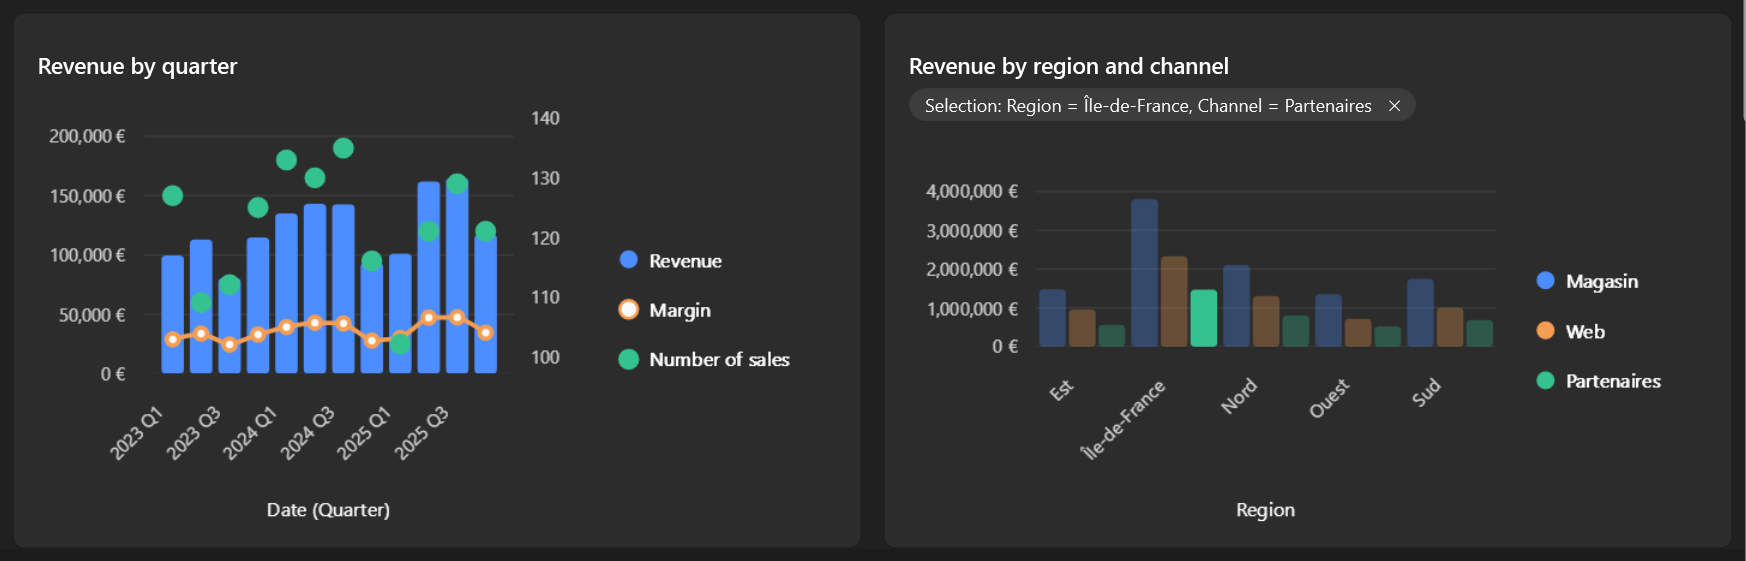
It works as soon as the visuals share a FilterContext, as for global filters.
What users do
| Action | Result |
|---|---|
| Click an element | It becomes the selection: the other visuals keep its rows. |
| Click it again | Clears the selection. |
| Ctrl + click in the same visual | Adds the element to the selection, or removes it: Region = Nord or Sud. |
| Ctrl + click in another visual | Adds that visual's selection: (Region = Nord or Sud) and Channel = Web. |
| Click the ✕ of a selection | Clears that visual's selection. |
| Click the ✕ of the filter bar's summary | Clears every selection. |
An element filters on the dimensions it shows: its category (every axis field), and its series for a chart with a legend. A clicked period (a quarter, a month) filters on that period.
A visual is not filtered by its own selection
It keeps showing everything, dims what is left out, and shows a summary of its selection.
In code
Filters.Selections;                       // one CrossFilter per visual with a selection
Filters.SelectionOf(visual.Id);
Filters.ClearSelection(visual.Id);
Filters.ClearSelection();                 // all of them
Filters.DescribeSelections(name => context.GetModel(name).Metadata);
Selections are not saved with the report: they are the state of a session.
In a connector
A connector reports clicks and draws the selection; EasyBI does the rest.
// On click (Select is null when the visual is not interactive, as in the designer's preview)
request.Select?.Invoke(new CategorySelection(category, series));

// When drawing: the elements outside the selection are dimmed
var opacity = request.IsEmphasized(category, series) ? 1 : SelectionFilters.DimmedOpacity;
Tables report a RowSelection and use IsRowEmphasized(row). See Writing a connector.