Semantic model
The semantic model is what you, the developer, declare: which fields of your data users can analyze, under which names. Users never see your classes or your tables, only the model.
SemanticModel.For(sales, "sales", "Sales")
  .Dimension(s => s.Date, "Date")
  .Dimension(s => s.Region, "Region")
  .Dimension(s => s.Channel, "Channel")
  .Dimension(s => s.Product.Category,
             "Category")
  .Dimension(s => s.Product.Name,
             "Product")
  .Measure(s => s.Amount, "Revenue",
           format: "#,##0 €")
  .Measure(s => s.Margin, "Margin",
           format: "#,##0 €")
  .Measure(s => s.Quantity, "Quantity")
  .Count("Number of sales")
  .Ratio(s => s.Margin, s => s.Amount,
         "Margin rate", "MarginRate",
         format: "P1");
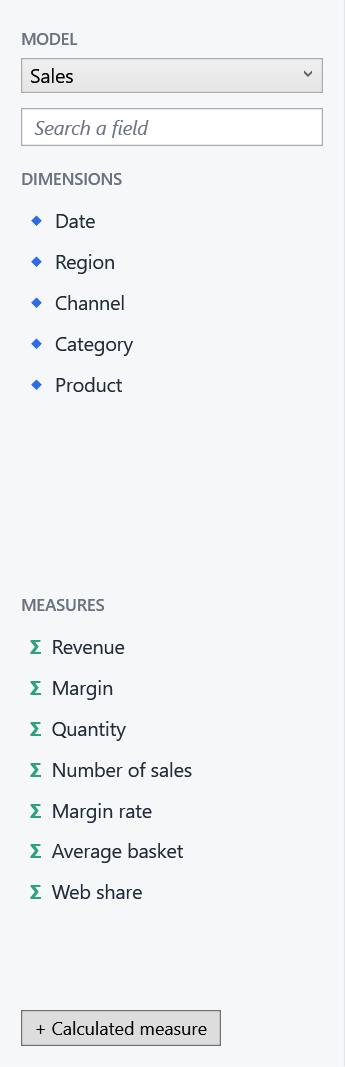
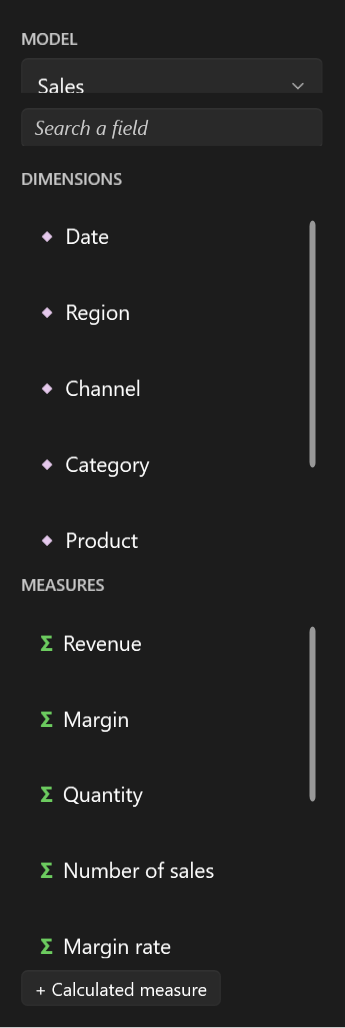
Dimensions
A dimension is what users group or filter by: a region, a channel, a date, a product category.
.Dimension(s => s.Region, "Region")
.Dimension(s => s.Product.Category, "Category")          // (1)!
.Dimension(s => s.Customer.Country, "Country", name: "Country") // (2)!
- Navigation properties work: with EF Core, they become joins in SQL.
- The name is the member path by default (
Customer.Country); give your own to keep reports stable when the class changes.
What users can do with a dimension depends on its type:
| Type | Examples | Users can |
|---|---|---|
| Text | string, enum |
Group, filter on values, search |
| Number | int, decimal, double |
Group, filter on values or ranges (≥, <, between) |
| Date | DateTime, DateOnly, DateTimeOffset |
Group by year, quarter, month or day; filter on periods (this year, last 12 months, between) |
| Boolean | bool |
Group, filter on yes / no |
Measures
A measure is what users add up: a revenue, a quantity, a number of sales.
.Measure(s => s.Amount, "Revenue", format: "#,##0 €")              // summed by default
.Measure(s => s.UnitPrice, "Unit price", Aggregation.Average, "C2") // (1)!
.Count("Number of sales")                                          // (2)!
- The default aggregation; users can switch to
Sum,Average,Min,MaxorCountin the designer. - Counts rows. Its name is
Countunless you give another.
Formats are .NET format strings, applied in the user's culture: N0 (12,345), #,##0 € (12,345 €), C2
(currency of the culture), P1 (12.3%). Users can override them per visual, with conditional
formatting too.
Calculated measures
A ratio cannot be summed: the margin rate of a region is its total margin divided by its total revenue, not the average of its sales' rates. Calculated measures are computed per group, inside the query:
| Method | For | Example |
|---|---|---|
Ratio |
A sum divided by a sum | Margin rate, average basket |
Calculated |
Any aggregate expression | g => g.Sum(s => s.Amount) - g.Sum(s => s.Cost) |
Formula |
A formula users can read and rewrite | SUM([Amount]; [Channel] = "Web") / [Amount] |
Users create their own too. See Calculated measures.
Names and captions
Every model and field has two labels:
| Seen by | Example | Must | |
|---|---|---|---|
| Name | Reports (JSON), your code | sales, Amount, Product.Category |
Stay stable: saved reports refer to it |
| Caption | Users | Sales, Revenue, Category |
Read well; can follow the language |
Renaming a property breaks saved reports
A field's name defaults to its member path. Before renaming a property of your class, give the field its old name
explicitly (name: "Amount"), or saved reports will show the field as missing (EasyBIContext.Validate lists such
problems).
Captions can follow the user's language: call .Localize(MyStrings.ResourceManager) and every caption becomes a
resource key. See Localization.
Data sources
Queries run in LINQ to objects, in parallel.
Each query opens its own DbContext (from an IDbContextFactory) and disposes it: the visuals of a dashboard query
in parallel.
Every visual becomes one query, with its filters, grouping, aggregates, sort and Top N inside the IQueryable. With
EF Core, that is one SQL statement: only the aggregated rows reach the application, whatever the size of the table.
The SQL of a visual
Revenue by region, top 3, on SQL Server, is roughly:
SELECT TOP(3) [s].[Region], SUM([s].[Amount])
FROM [Sales] AS [s]
GROUP BY [s].[Region]
ORDER BY SUM([s].[Amount]) DESC
Keep dimension and measure expressions translatable by your provider: a method call EF Core cannot translate fails when the visual queries.
Several models
Add as many models as you need; the designer lets users pick one, and each visual uses a single model.
EasyBIContext.Create()
    .AddModel(salesModel)
    .AddModel(stockModel)
    .UseRenderer(new LiveCharts2Renderer());
When the data changes
Visuals cache their last result and query again only when their own query changes. When the rows change (an import, another data source), tell them, from any thread:
When a query fails
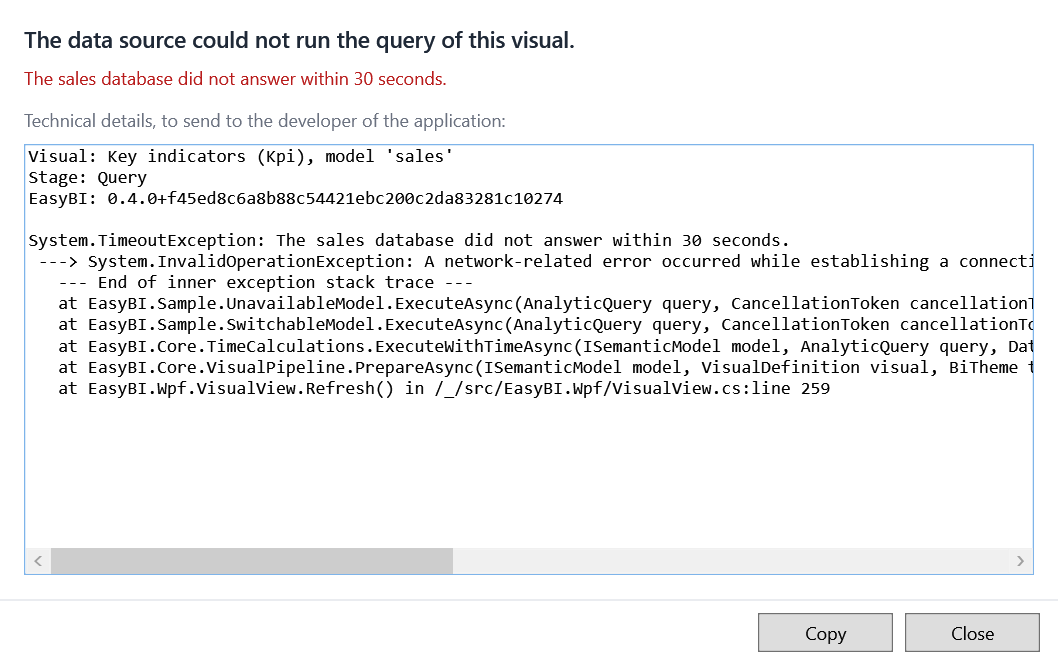
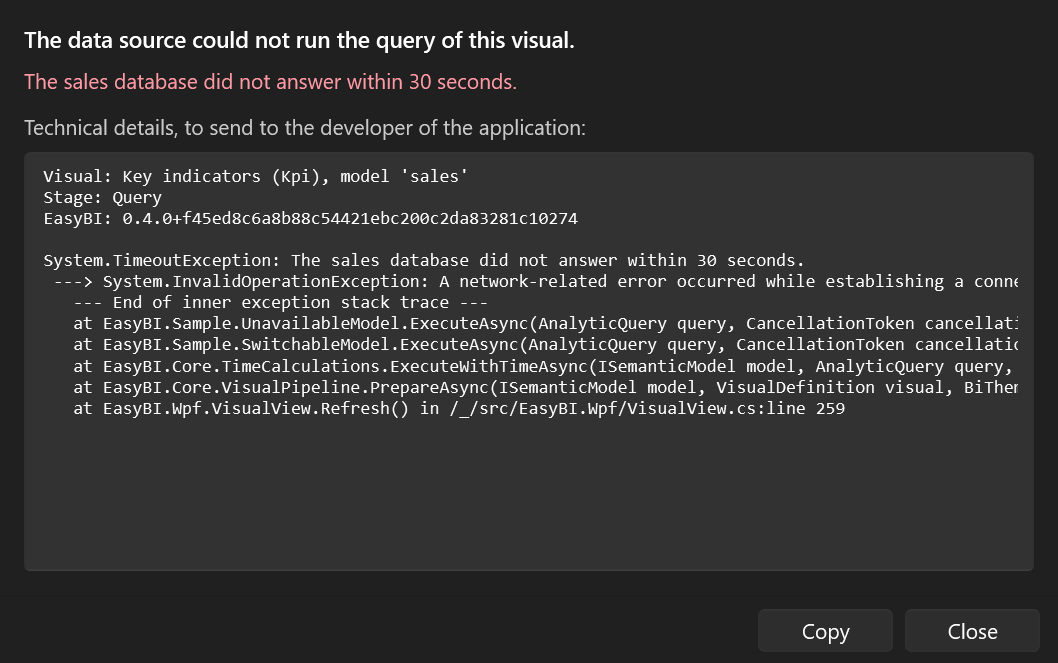
A visual whose query throws (a database out of reach, an expression EF Core cannot translate) or whose renderer throws does not show the exception: it says it could not be displayed, with Retry, which runs the query again, and See what happened.
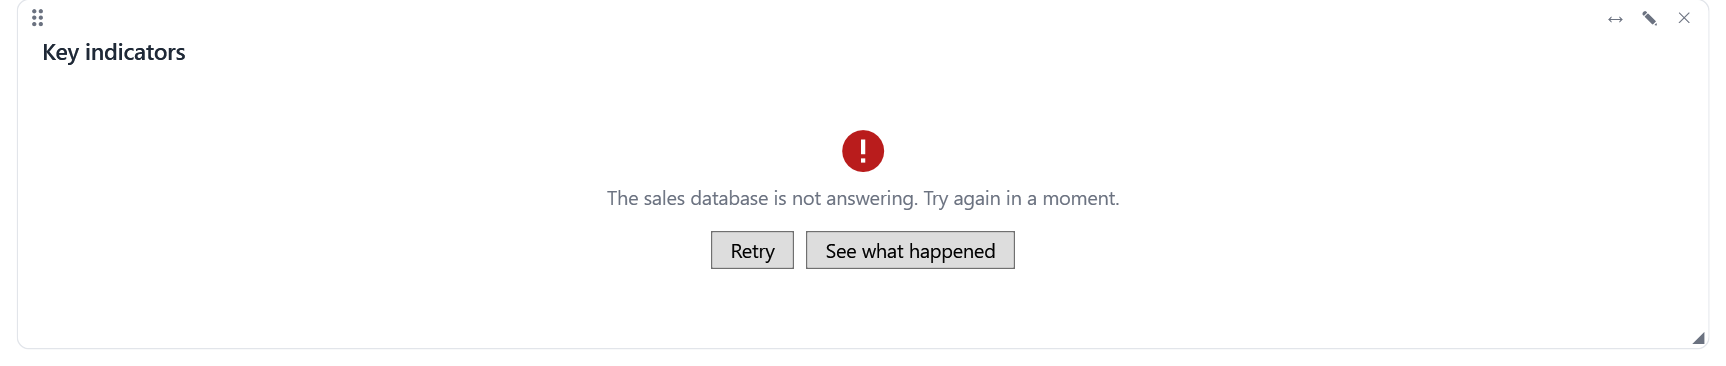
The details tell what failed (the query or the renderer) and give the visual, the version of EasyBI and the exception with its stack trace, ready to copy into a bug report.
EasyBIContext.VisualFailed tells the application first: log the failure, say what happened in the user's words, or
keep the details from the user.
context.VisualFailed += (_, e) =>
{
    logger.LogError(e.Exception, "Visual {Title} failed ({Stage})", e.Visual.Title, e.Stage);
    if (e.Exception is TimeoutException) e.Message = "The sales database is not answering. Try again in a moment.";
    e.ShowDetails = false;   // no technical details in production
};
e.Stage is Query or Render (with e.Renderer), and e.Details is the text the details show. The sample shows it
with its Unavailable source data source.
Your own data source
A visual asks its model for its data, not for queries: ISemanticModel.GetDataAsync receives a
VisualDataRequest and answers with a VisualData. Where the data comes from, and how the request travels, is up to
the model: SemanticModel.For runs it in the application over an IQueryable; another model can send it to a server,
which answers with the visual's result.
VisualDataRequest |
|
|---|---|
Visual |
The visual, with the filters of its page and the selections of other visuals applied |
Measures |
The end user's calculated measures it uses, with those they use |
HasTooltips |
Whether its type shows tooltips, whose measures are queried with it |
Today |
The user's date: relative periods (this year, last 12 months) and comparisons with a year earlier |
UICulture, FormatCulture |
The cultures of the captions and of the texts of values in the result (null for the model's own) |
VisualData holds the visual's ResultSet and, for a matrix, its pivoted MatrixData. The request only holds data
that serializes; the drawing (chart data, theme, renderer) always stays in the application.
public sealed class SqlSalesModel : QuerySemanticModel
{
    public override ModelMetadata Metadata { get; } = ...;

    public override Task<ResultSet> ExecuteAsync(AnalyticQuery query, CancellationToken cancellationToken = default)
        => ...; // filters, groups, aggregates, sort, Top and calculated measures

    public override Task<DistinctValues> GetDistinctValuesAsync(DistinctValuesRequest request, CancellationToken cancellationToken = default)
        => ...; // at most request.Limit values, those containing request.Search when it is given
}
QuerySemanticModel turns the request into AnalyticQuerys and composes their results: comparisons with a year
earlier, year-to-date totals, the levels and totals of a matrix. Periods relative to today reach ExecuteAsync as
date ranges, on the request's date.
public sealed class RemoteSalesModel(HttpClient http, ModelMetadata metadata) : ISemanticModel
{
    public ModelMetadata Metadata { get; } = metadata; // (1)!

    public async Task<VisualData> GetDataAsync(VisualDataRequest request, CancellationToken cancellationToken = default)
    {
        using var content = new StringContent(DataSerializer.Serialize(request), Encoding.UTF8, "application/json");
        using var response = await http.PostAsync("sales/data", content, cancellationToken);
        response.EnsureSuccessStatusCode();
        return DataSerializer.DeserializeData(await response.Content.ReadAsStringAsync());
    }

    public async Task<DistinctValues> GetDistinctValuesAsync(DistinctValuesRequest request, CancellationToken cancellationToken = default)
    {
        using var content = new StringContent(DataSerializer.Serialize(request), Encoding.UTF8, "application/json");
        using var response = await http.PostAsync("sales/values", content, cancellationToken);
        response.EnsureSuccessStatusCode();
        return DataSerializer.DeserializeValues(await response.Content.ReadAsStringAsync(), Metadata.GetField(request.Field).DataType);
    }
}
- Read once from the server:
DataSerializer.DeserializeMetadata(await http.GetStringAsync("sales/metadata")).
The server answers with any ISemanticModel, here ASP.NET Core over EF Core:
var sales = SemanticModel.For(() => new SalesDbContext(options), db => db.Sales, "sales", "Sales")...;

app.MapGet("/sales/metadata", () => Results.Json(sales.Metadata, DataSerializer.Options));
app.MapPost("/sales/data", async (HttpRequest http, CancellationToken cancellationToken) =>
{
    var request = await JsonSerializer.DeserializeAsync<VisualDataRequest>(http.Body, DataSerializer.Options, cancellationToken);
    return Results.Json(await sales.GetDataAsync(request!, cancellationToken), DataSerializer.Options);
});
app.MapPost("/sales/values", async (HttpRequest http, CancellationToken cancellationToken) =>
{
    var request = await JsonSerializer.DeserializeAsync<DistinctValuesRequest>(http.Body, DataSerializer.Options, cancellationToken);
    return Results.Json(await sales.GetDistinctValuesAsync(request!, cancellationToken), DataSerializer.Options);
});
DataSerializer writes the request, the data, the metadata and the distinct values as plain JSON (see
Data format): the server can be written in another language. The routes, the
transport (HTTP, gRPC, a message bus...) and its security are yours. The sample does exactly this: see
samples/EasyBI.Sample.Server and the Server over HTTP data source.
VisualPipeline.PrepareAsync asks a model for a visual's data and builds what renderers draw; VisualPipeline.Prepare
does it with data obtained otherwise.