Dashboard
A dashboard shows several visuals that users arrange themselves: they drag fields onto it to make visuals, move and resize them, filter them all at once, and click a chart to filter the others.
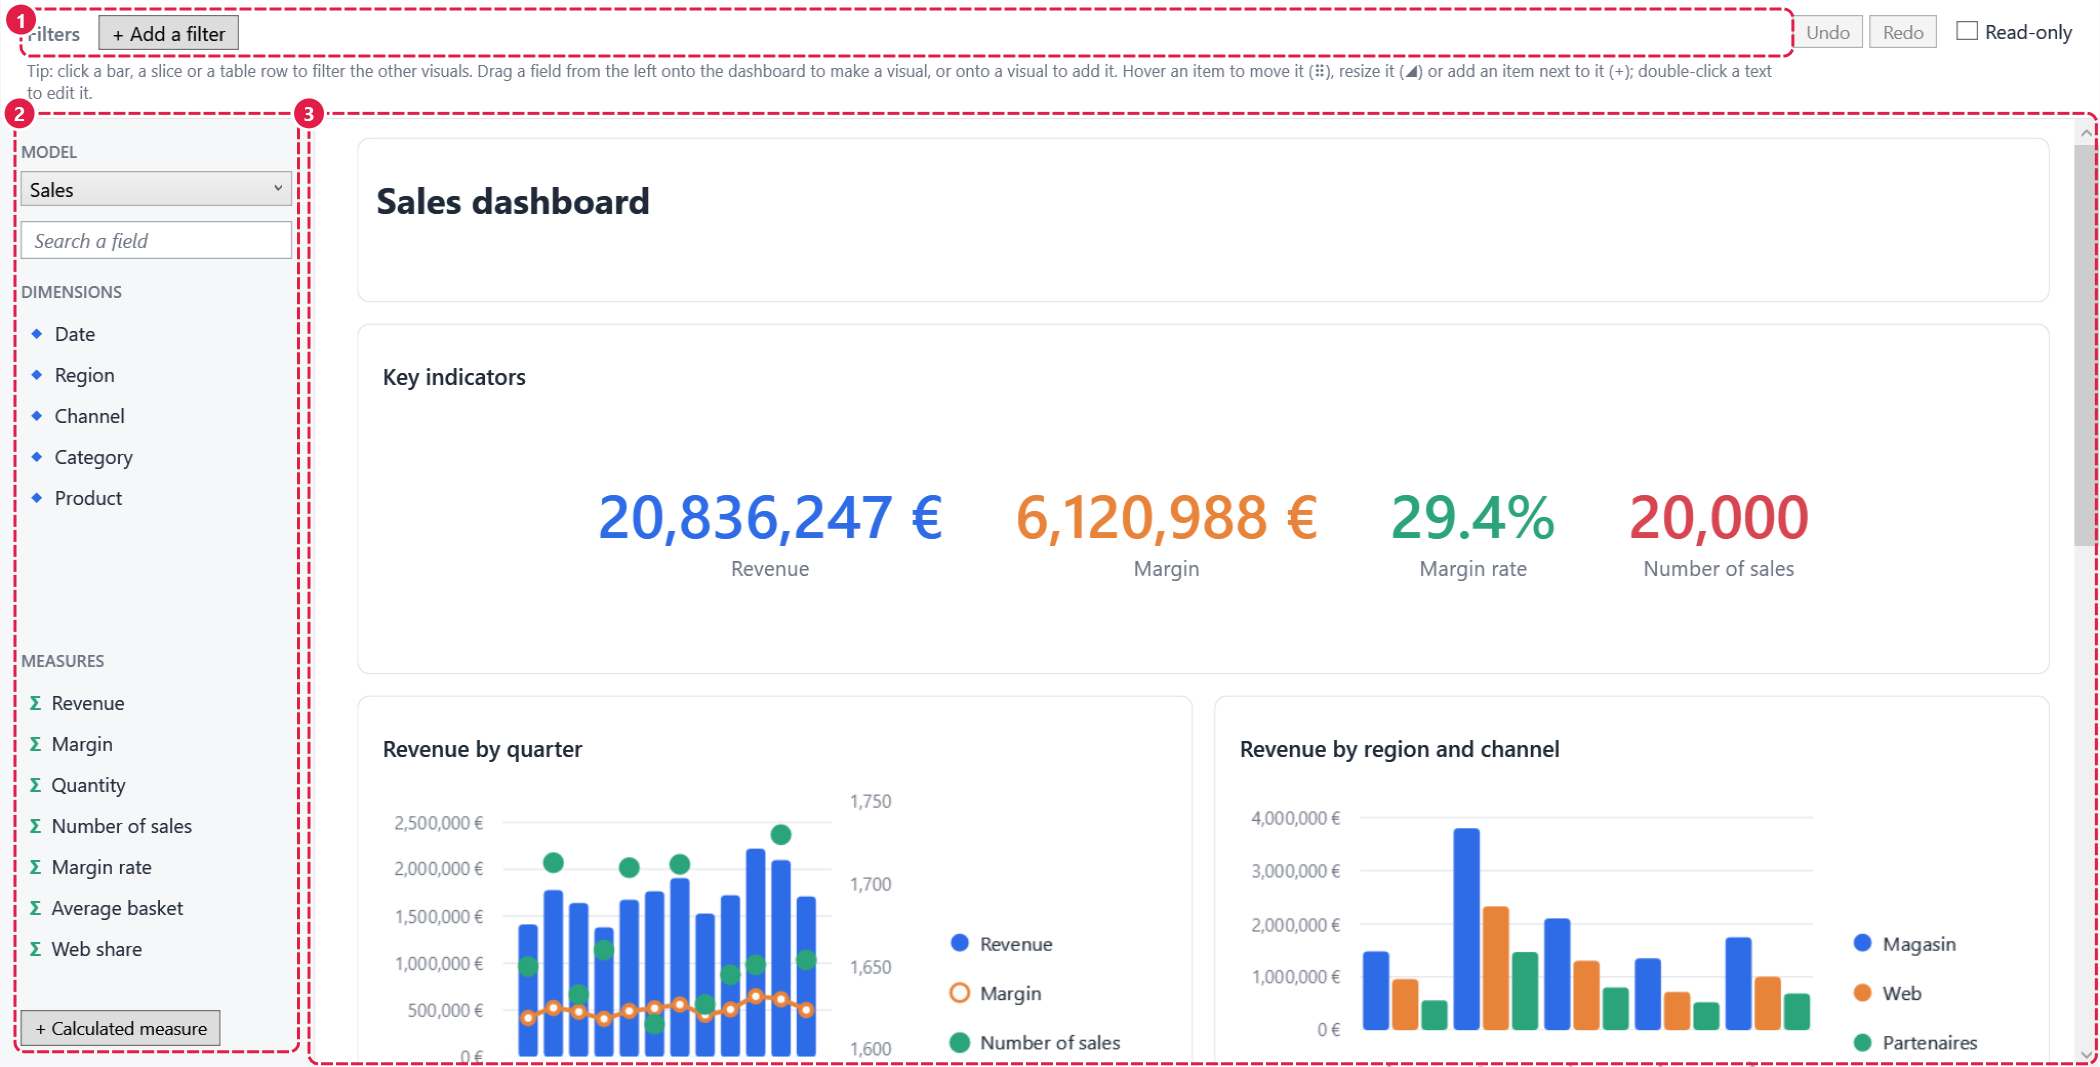
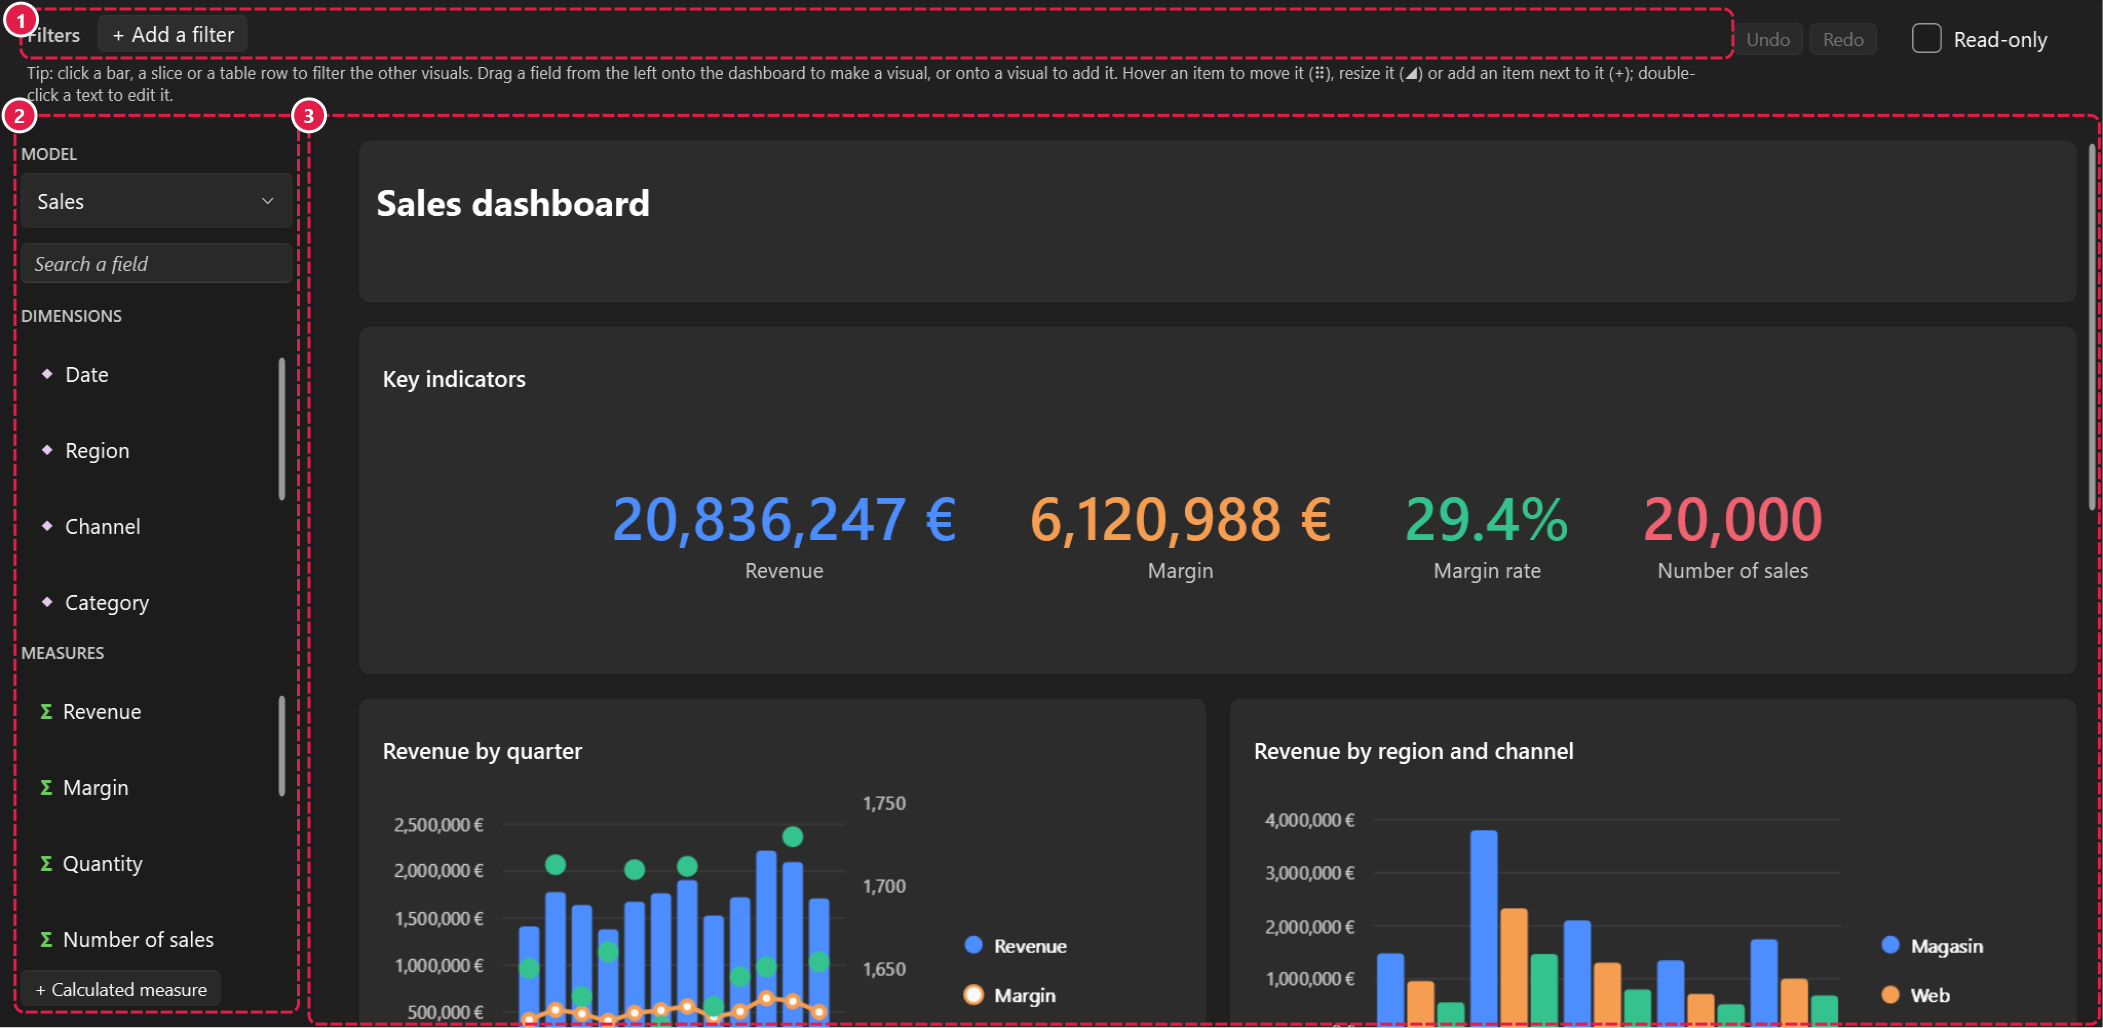
| Control | Role | |
|---|---|---|
| 1 | FilterBar |
Global filters and the summary of the selections: see Filters. |
| 2 | FieldList |
The fields to drag onto the dashboard to make visuals. |
| 3 | DashboardView |
The visuals, texts and images, arranged in bands. |
Show it
<DockPanel bi:VisualView.FilterContext="{Binding Filters}"> <!-- (1)! -->
    <bi:FilterBar DockPanel.Dock="Top" Context="{Binding Context}" />
    <bi:FieldList DockPanel.Dock="Left" Width="210" Context="{Binding Context}" />
    <bi:DashboardView Context="{Binding Context}" Document="{Binding Dashboard}" /> <!-- (2)! -->
</DockPanel>
- Shared by the filter bar and every visual: global filters and cross-filtering.
- Two-way: every change users make comes back into
Dashboard, aDashboardDocument.
Each part is optional: a dashboard without a field list is arranged with its "+" buttons, one without a filter context does not cross-filter.
Save and open
A DashboardDocument is the report (easybi/v1: visuals, filters, calculated measures) and its layout. It is saved
as JSON, with the schema easybi-dashboard/v1:
Plain reports open too
DashboardSerializer.Deserialize also reads an easybi/v1 report without a layout: its visuals get a default one.
The layout is a WPF matter and never goes into the report itself.
Read-only
No editing chrome, no editing command, no selection. Clicks keep cross-filtering. IsReadOnly is inherited, so item
templates can use it.
Performance
Only the visuals in or near the visible part of the dashboard query their data; the others query when they scroll into view. A change of filters or data costs them one query then.
| Property | |
|---|---|
ViewportMargin |
How far ahead items load, in viewport sizes (1 by default: a screen above and below). |
LoadsVisibleItemsOnly |
false loads every visual, to print or export the whole dashboard. |
Next
-
Build visuals from fields, move, resize, select, copy and paste, undo.
-
Bands, columns and lines; what the layout looks like in code.
-
Behaviors, events, commands, styles and slots.