Getting started
In ten minutes: a WPF window that shows a chart of your data, then a designer where your users build their own.
1. Install
EasyBI runs on .NET 8 and on .NET Framework 4.6.2 or later. EasyBI.Wpf brings EasyBI.Core and
EasyBI.Abstractions. Pick the charting library you prefer: EasyBI.Renderers.OxyPlot
draws the same charts with OxyPlot.
Your application uses WPF UI or Material Design?
Add EasyBI.Themes.WpfUi or EasyBI.Themes.MaterialDesign: EasyBI then follows its colors, light or dark. See
Theming.
2. Describe your data
A semantic model tells EasyBI what can be analyzed in a collection: its dimensions (what you group by: a region, a date...) and its measures (what you add up: a revenue, a quantity...).
public sealed record Sale(DateTime Date, string Region, string Channel,
                          decimal Amount, int Quantity);

var model = SemanticModel.For(sales, "sales", "Sales") // (1)!
    .Dimension(s => s.Date, "Date")
    .Dimension(s => s.Region, "Region")
    .Dimension(s => s.Channel, "Channel")
    .Measure(s => s.Amount, "Revenue", format: "#,##0 €") // (2)!
    .Measure(s => s.Quantity, "Quantity")
    .Count("Number of sales");
salesis anyIEnumerable<Sale>orIQueryable<Sale>: a list in memory, or a table of EF Core."sales"is the name reports use,"Sales"the caption users see.- A measure is summed by default; users can switch it to an average, a minimum...
The semantic model page covers everything a model can declare, and how to plug a database.
3. Create the context
The context gathers your models and the renderers that draw the charts. Create one for the application, and keep it: every EasyBI control of the application uses it.
public partial class MainWindow : Window
{
    public EasyBIContext Context { get; } = EasyBIContext.Create()
        .AddModel(model)
        .UseRenderer(new LiveCharts2Renderer());

    public MainWindow()
    {
        InitializeComponent();
        DataContext = this;
    }
}
4. Show a chart
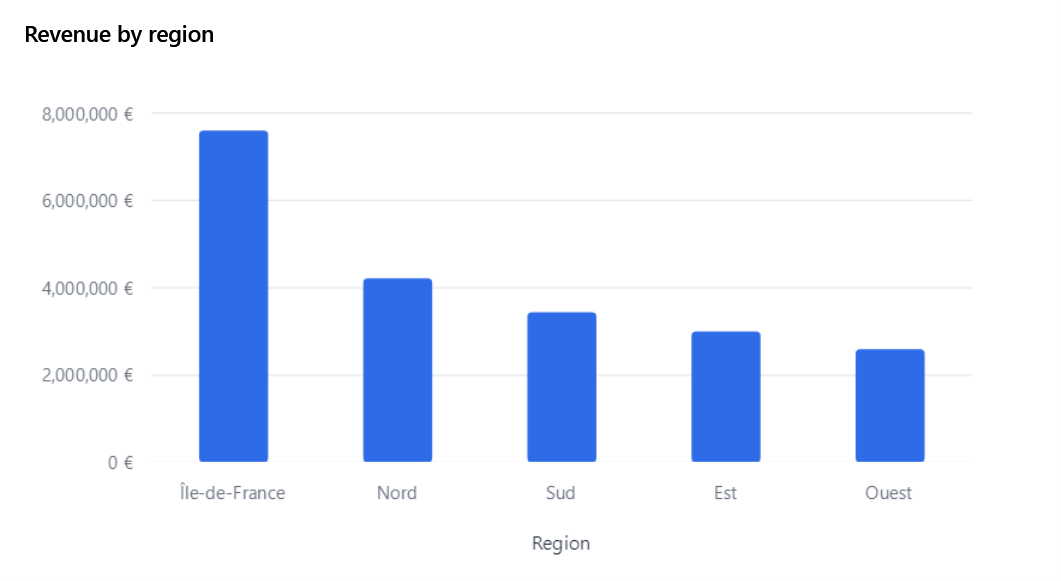
A visual says what to show: the model, the type of chart, the fields on each axis. A VisualView draws it.
public VisualDefinition RevenueByRegion { get; } = new()
{
    Title = "Revenue by region",
    Model = "sales",
    Type = VisualType.Bar,
    Axis = [new("Region")],                     // (1)!
    Values = [new("Amount")],                   // (2)!
    Sort = new("Amount", Descending: true),
};
- Fields are referred to by name: the member name by default (
Region,Product.Category). Amountis the measure captioned "Revenue".
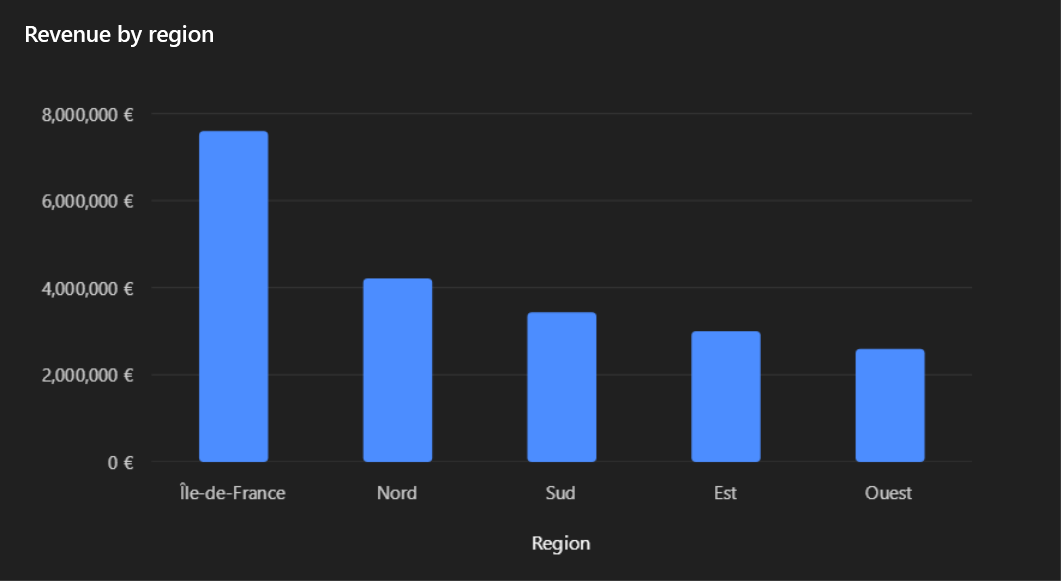
Run the application: the chart of the top of this page shows. The query runs in the background, grouped and summed by the model (in SQL with EF Core), so only the five totals reach the chart.
5. Let your users design
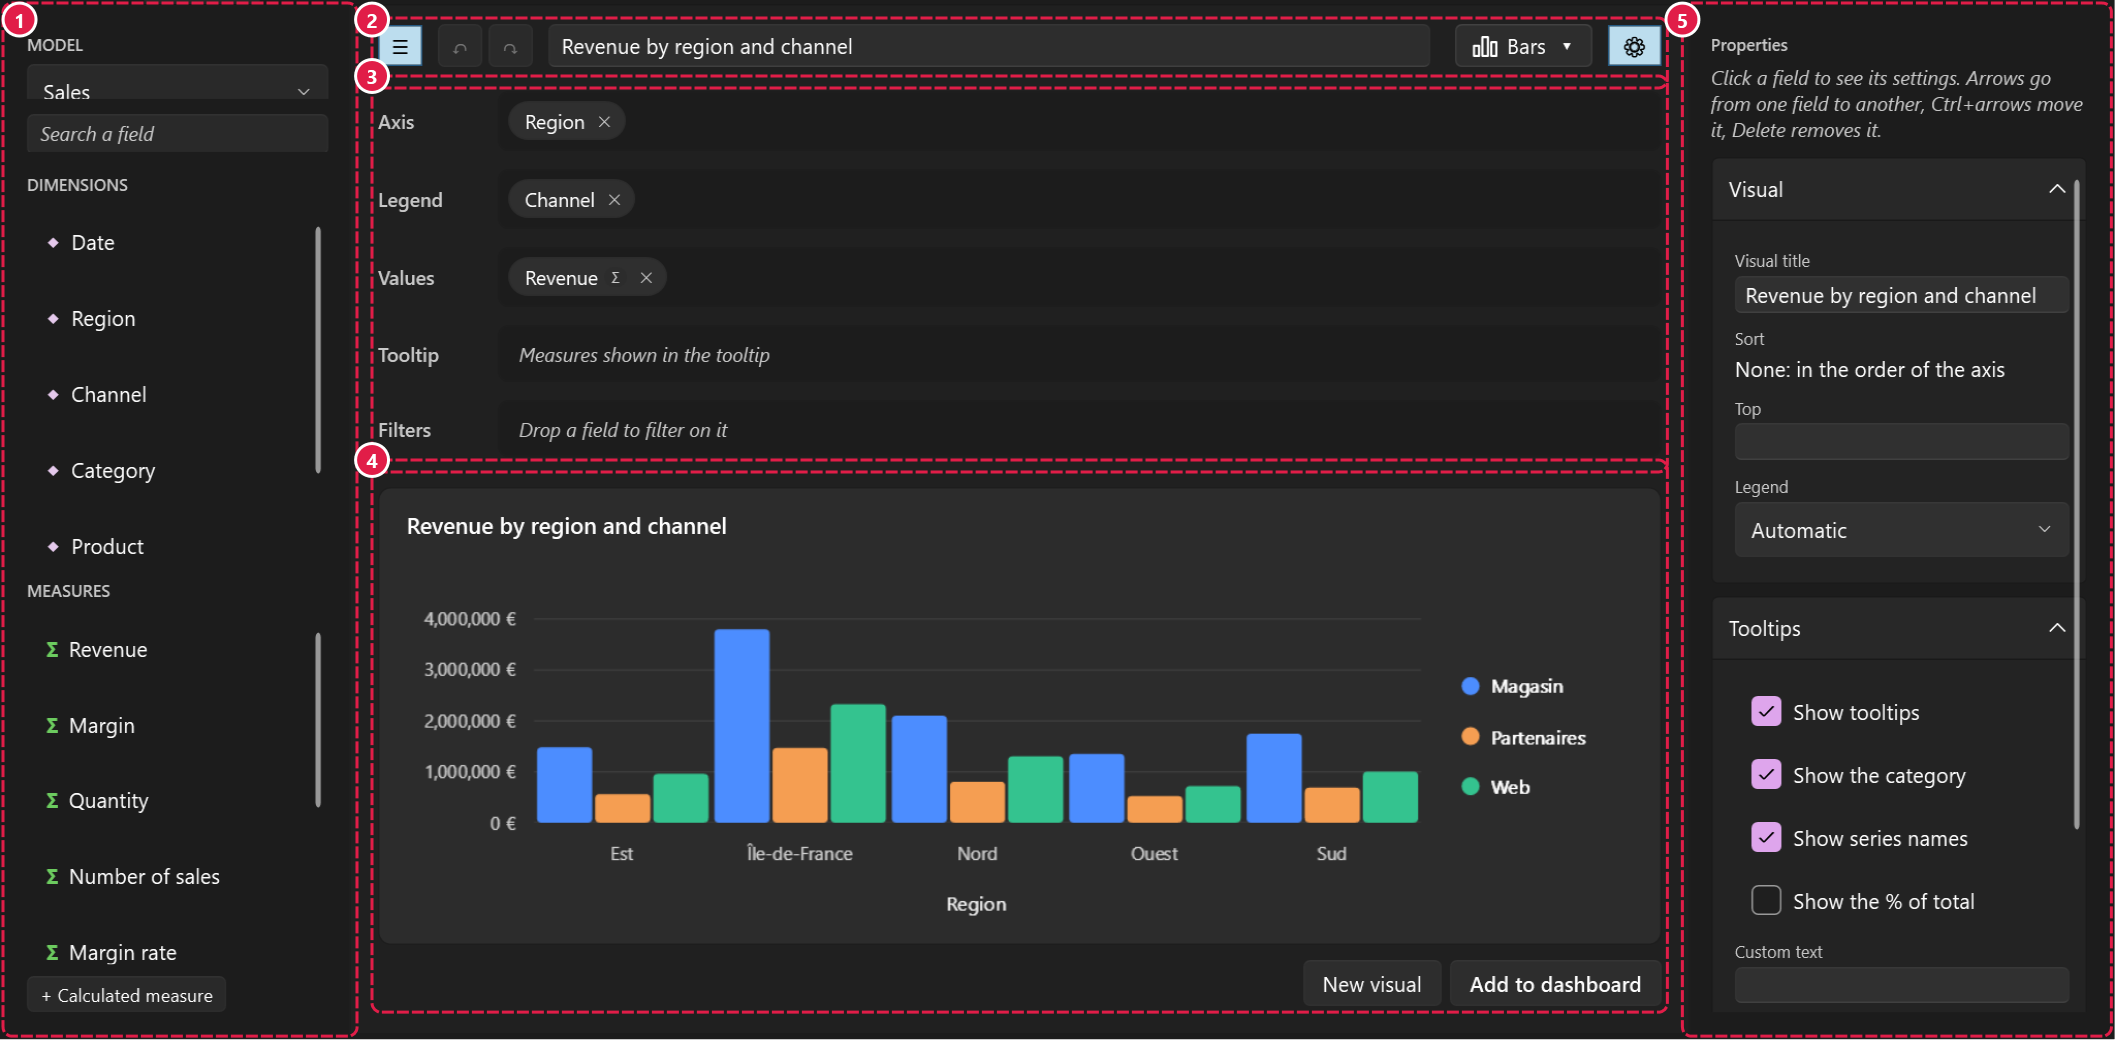
Replace the hard-coded visual with a designer: users drag fields, pick a type, and the visual follows.
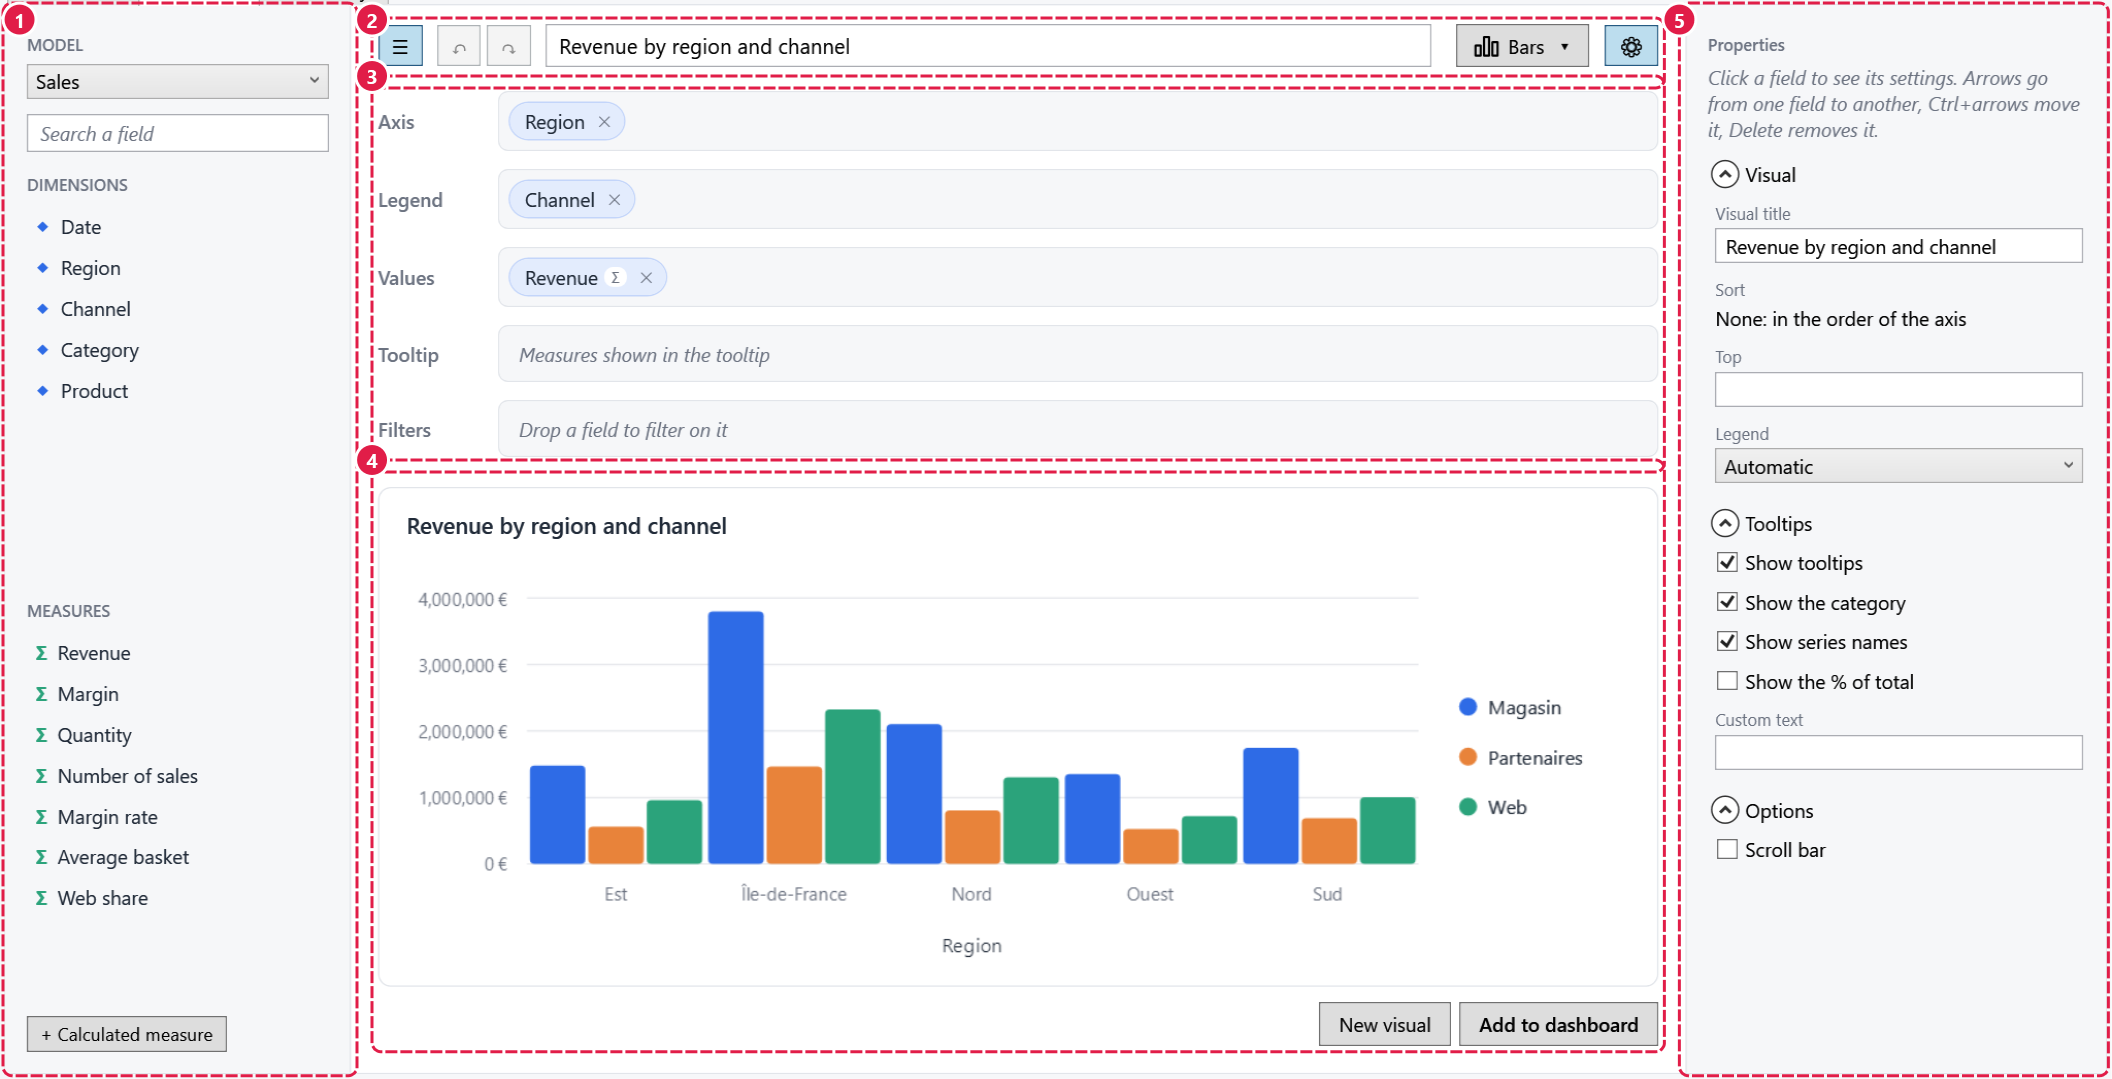
Visual is two-way: what users build comes back into your property. See The designer.
6. Save and open reports
Visuals and reports are plain records, saved as JSON (the easybi/v1 format):
var report = new ReportDefinition { Title = "Sales", Visuals = [RevenueByRegion] };
File.WriteAllText("sales.json", ReportSerializer.Serialize(report));

var opened = ReportSerializer.Deserialize(File.ReadAllText("sales.json"));
{
  "schema": "easybi/v1",
  "title": "Sales",
  "visuals": [
    { "title": "Revenue by region", "model": "sales", "type": "Bar", "axis": [ { "field": "Region" } ], ... }
  ]
}
See the report format.
Next steps
-
Several visuals, arranged by your users, with cross-filtering.
-
A filter bar for the whole dashboard, and clicks on a chart that filter the others.
-
Ratios and formulas, written by you or by your users.
-
Everything together:
dotnet run --project samples/EasyBI.Sample.
About the sample
The sample starts in your system language (English or French) and has a language picker in its toolbar. Its data
picker switches the same sales between memory (20,000 rows) and a SQLite database of 1 or 5 million rows, created
once in %LOCALAPPDATA%\EasyBI.Sample; the toolbar shows how long the last refresh took. Its Server over HTTP
source gets the results of visuals from samples/EasyBI.Sample.Server: start it first with
dotnet run --project samples/EasyBI.Sample.Server.