Writing a connector
A connector draws EasyBI's visuals with a charting library. EasyBI comes with two, which draw the same visual their own way:
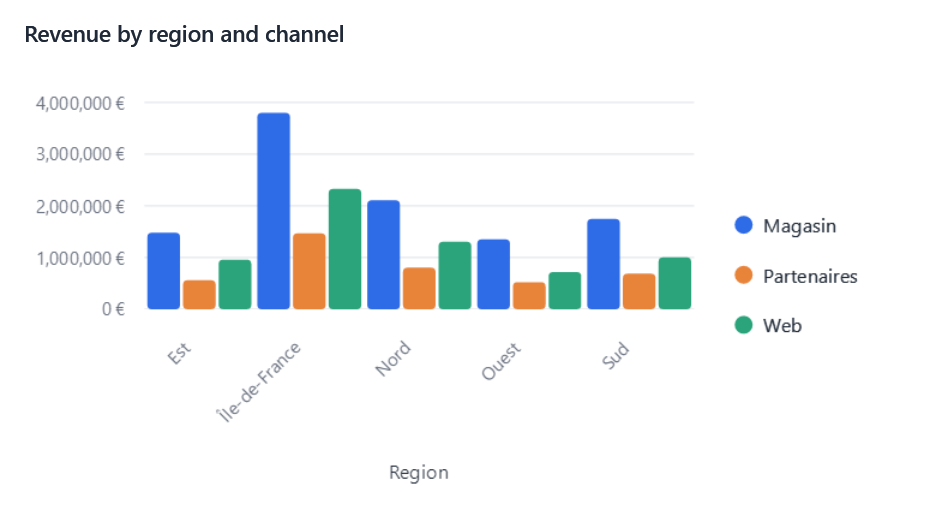
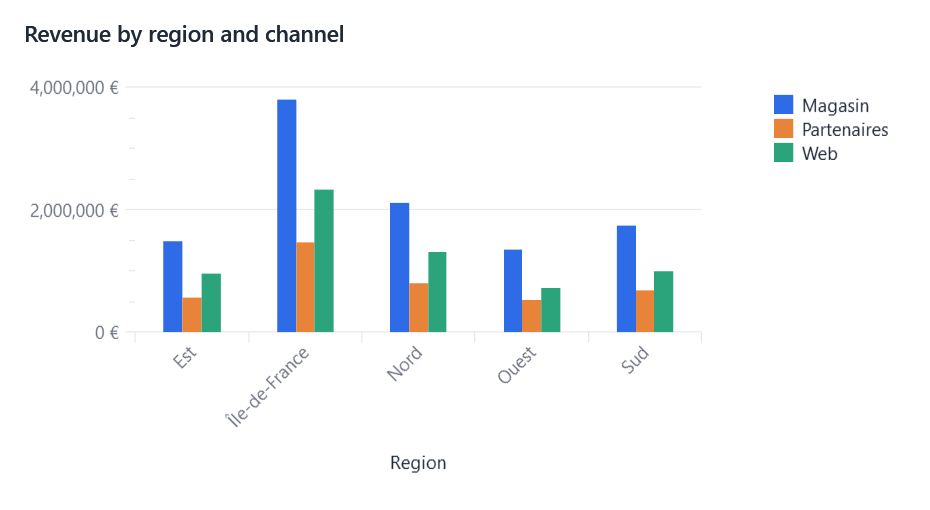
| EasyBI does | The connector does |
|---|---|
| Queries, pivots, sorts, applies filters and time calculations | Draws request.Chart with its library |
| Picks the renderer for each visual | Declares the types it draws |
| Builds tooltips, legends' pages, colors of conditional formats | Shows them, from request |
| Turns clicks into cross-filtering | Reports clicks with request.Select |
A connector implements a single interface. It receives already queried and pivoted data
(request.Chart: categories + series) and the raw ResultSet if needed:
public sealed class MyRenderer : IVisualRenderer
{
    public string Name => "MyLib";
    public RendererCapabilities Capabilities { get; } = new(new HashSet<VisualType> { VisualType.Bar });
    public FrameworkElement Render(RenderRequest request) { /* request.Chart.Categories, request.Chart.Series */ }
}
A connector can also draw a type of its own, which it declares in Capabilities.VisualTypes: see
Custom visual types.
Each ChartSeries comes with its resolved SeriesType and SecondaryAxis: a connector draws every series with its own
type, so one chart can mix bars, lines, areas and points.
Colors come from request.Theme: series take ColorAt(index), text Foreground, axis labels MutedForeground, grid
lines GridLine, tooltips Background (each one null when the theme does not set it: keep the library's default).
Draw on a transparent background, so that the chart sits on the theme's surface.
Tooltips are EasyBI's: a connector replaces its library's tooltip (or tracker) with a ChartTooltipHost
(EasyBI.Wpf), and shows in it, while the pointer moves over the chart, the content of the hovered category and series:
var tooltip = new ChartTooltipHost(view);
view.MouseMove += (_, e) => tooltip.Show(HitTest(e.GetPosition(view)) is { } hit
    ? request.TooltipFor(hit.Category, [hit.Series])   // EasyBI.Core: the visual's settings and the application's changes
    : null);                                           // null hides it
Legends follow ChartFitting (EasyBI.Core), which gives the place of the legend and its pages for the chart's size,
the visual's choice (request.Visual.LegendPosition) and the size of the library's entries (LegendMetrics). The host
turns the pages through request.LegendPager: a connector shows the entries of its page and fits again when it changes.
void Fit()
{
    var fit = ChartFitting.Cartesian(request.Chart, view.ActualWidth, view.ActualHeight, request.Visual.LegendPosition, MyMetrics);
    var shown = ChartFitting.LegendEntries(fit, request.LegendPager);   // also tells the pager where the legend is
    for (var i = 0; i < series.Count; i++) series[i].ShowInLegend = shown(i);
}
view.SizeChanged += (_, _) => Fit();
if (request.LegendPager is { } pager) pager.Changed += (_, _) => Fit();
EasyBIContext.ResolveRenderer negotiates capabilities: the active renderer if it supports every type the
visual uses (the visual's and its measures'), otherwise another plugged-in renderer, otherwise a built-in one. The designer disables
the types that no renderer can draw.
Renderer options
A connector offers settings of its own to the end user by declaring them in its capabilities: the designer shows them
in the "Options" section of its properties panel (DesignerPropertySections.Options) for the visuals they apply to, as
a check box, a list or a number box, and saves their values with the visual.
public RendererCapabilities Capabilities { get; } = new(marks)
{
    Options =
    [
        RendererOption.Toggle("scrollable", () => Strings.Scrollable, appliesTo: v => v.Type.IsCartesian()),
        RendererOption.Choice("curve", () => Strings.Curve, [new("straight", () => Strings.Straight), new("smooth", () => Strings.Smooth)]),
        RendererOption.Number("barWidth", () => Strings.BarWidth, 48, minimum: 4, maximum: 120),
    ],
};

public FrameworkElement Render(RenderRequest request)
{
    var scrollable = request.Visual.GetRendererOption<bool>(Name, "scrollable");   // EasyBI.Core
    ...
}
- Labels are functions, read when shown, so that they follow the EasyBI language (
EasyBILocalization.UICulture). - Values are stored in
VisualDefinition.Extensions, one JSON object per renderer under its name ("LiveCharts2": "{\"scrollable\":true}"); a value equal to the option's default is not stored. The settings of a renderer are kept while another one draws the visual.WithRendererOptionsets one in code. - The LiveCharts2 connector offers Scroll bar (
LiveCharts2Renderer.ScrollableOption) on cartesian charts: the chart shows the first 20 categories (ScrollWindow) above a small chart of all of them, where a band marks the visible ones; dragging on it scrolls, the mouse wheel on the chart zooms.