Building a visual
What the end user does in the designer, step by step. Everything here works out of the box: this page is also a base for your application's user help.
Add fields
Drag a field from the list onto a well, or double-click it: a dimension goes to the axis, a measure to the values.
While a field is dragged, the wells tell whether they take it. Below, Channel (a dimension) is dragged over a bar
chart: the axis, the legend and the filters take it, the values do not.
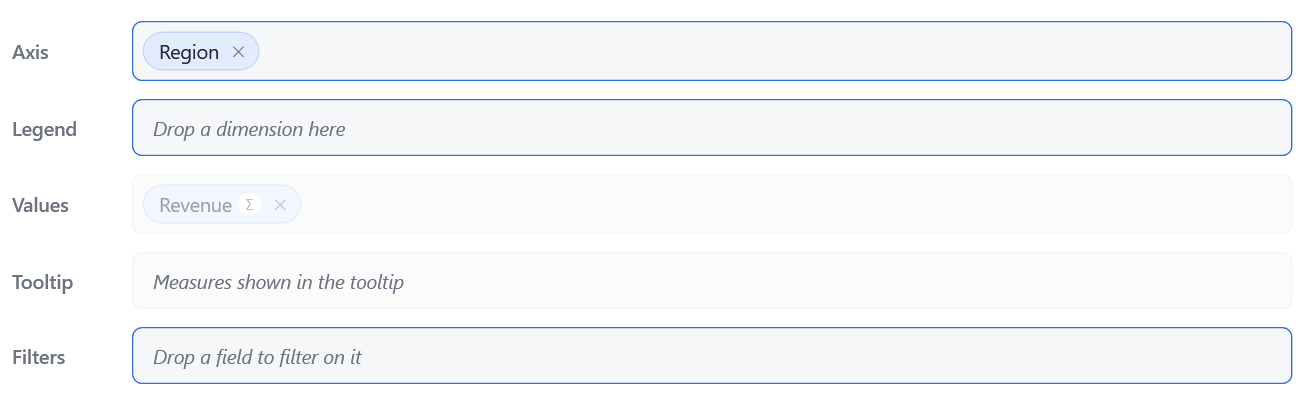
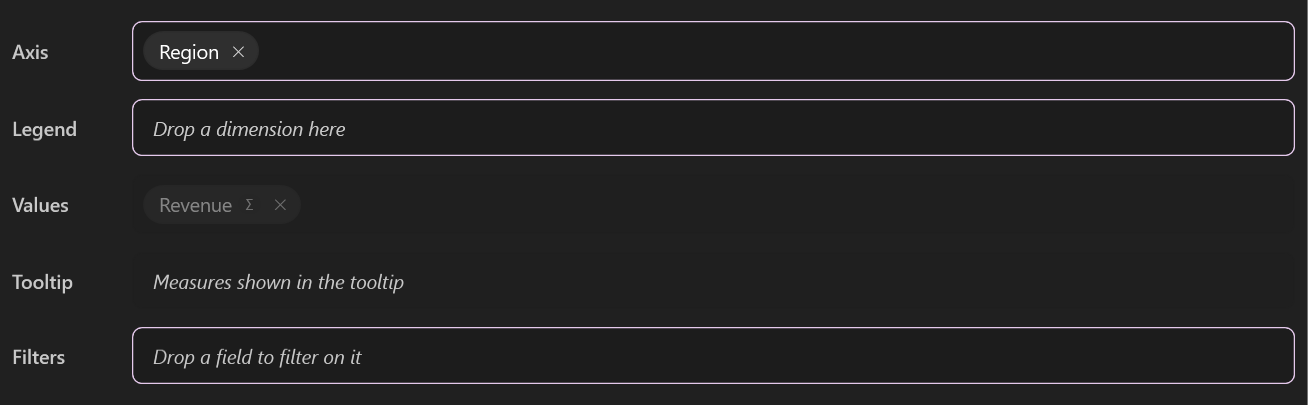
A well that refuses a field says why, in the end user's language:
| Refusal | When |
|---|---|
| Only measures go in Values | A dimension dropped on the values. |
| Only dimensions go in Axis | A measure dropped on the axis or the legend. |
| Region is already in Axis | The field is already there. |
| Category holds a single field | The type allows one field there (a pie's category). |
| Axis is not used by this type of visual | A KPI has no axis, for instance. |
| Region belongs to the model "Sales": choose this model first | The field is from another model. |
Pick a visual type
The type button opens a gallery grouped by use. A type that the active renderer cannot draw is greyed.
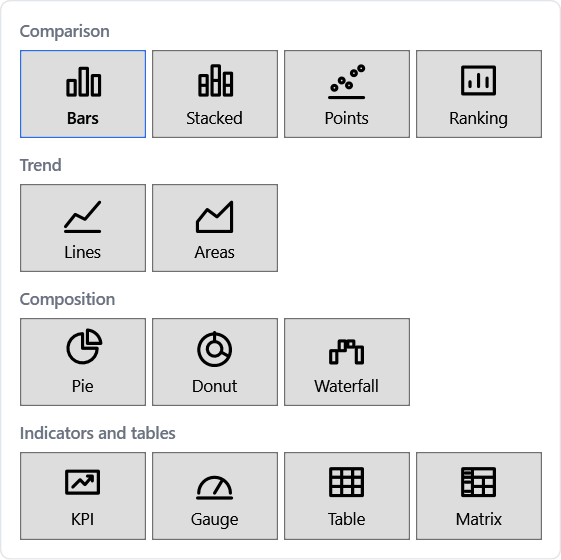
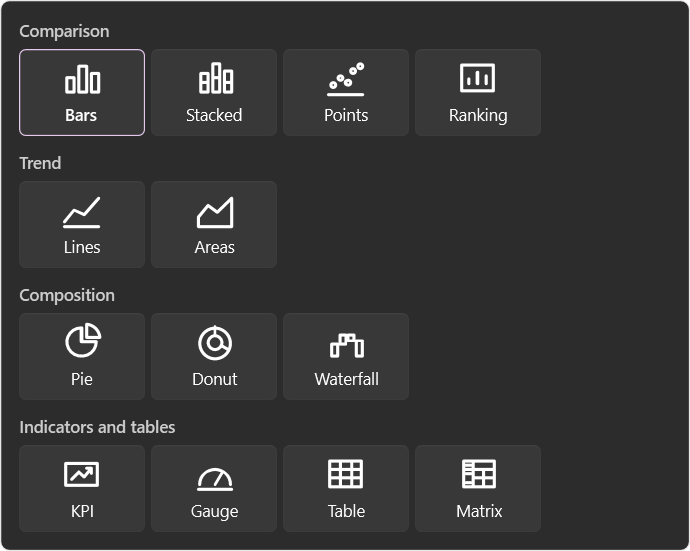
The wells follow the type: their names and limits change, and the wells a type does not use disappear.
| Type | Wells |
|---|---|
| Bars, stacked bars, points, lines, areas | Axis (up to 3 fields), Legend, Values, Tooltip, Filters |
| Pie, donut | Category (1), Value (1), Tooltip, Filters |
| Waterfall | Axis (1 to 3), Value (1), Tooltip, Filters |
| KPI | Values, Filters |
| Gauge | Value (1), Filters |
| Table | Rows (up to 3), Values, Filters |
| Matrix | Rows (up to 4), Columns (1), Values, Filters |
Nothing is lost when the type changes
A well the new type does not use keeps its fields and stays shown, marked Not used by this type of visual, until the end user removes them or picks a type that uses them again.
Arrange the chips
A field in a well is a chip. Its badges sum its settings up: Σ or avg (aggregation), Quarter (grain), PY
(time comparison), Y2 (secondary axis), ↓ (sort).
- Move a chip by dragging it, within its well (the order of the axis or of the series) or to another well.
- Remove it with its
×, or with Del once selected. - Select it with a click: the properties panel shows its settings.
Set the details
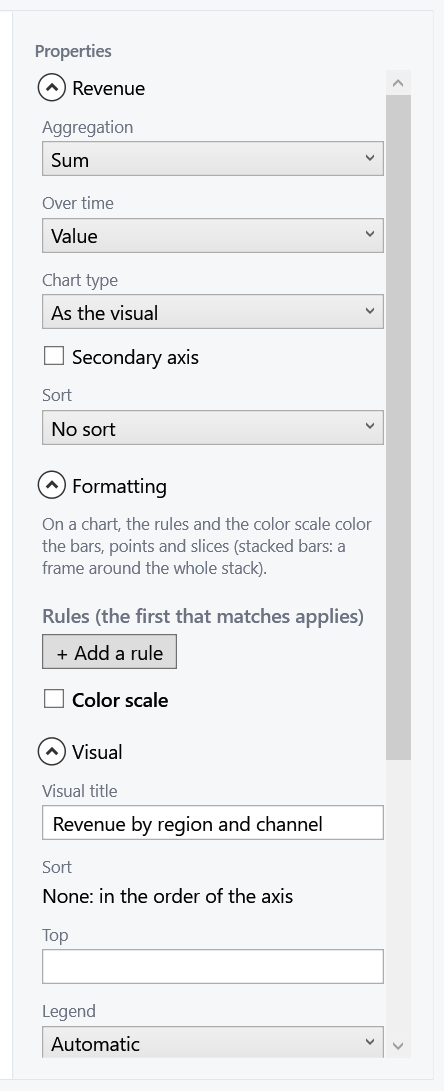
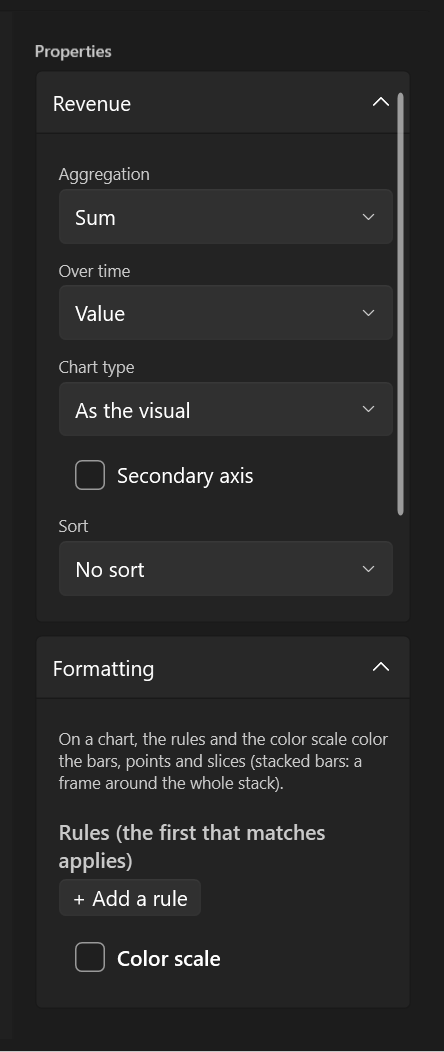
The properties panel shows the settings of the selected chip, in sections:
| Selection | Sections |
|---|---|
| A measure | Aggregation, time comparison, chart type and secondary axis, sort, formatting |
| A dimension | Grain (dates), sort, value labels |
| A filter | Its values, or a period for a date |
| Nothing (Escape) | Title, sort, Top N, legend, tooltips, the renderer's options |
Undo, redo, keyboard
Every change of the visual can be undone: Ctrl+Z, Ctrl+Y (or Ctrl+Shift+Z), or the header's arrows. The history keeps 100 steps and starts over when another visual is loaded.
Once a chip is selected, the keyboard drives the wells:
| Keys | Action |
|---|---|
| Left / Right | Previous / next chip |
| Up / Down | Chip of the well above / below |
| Ctrl+Left / Ctrl+Right | Move the selected chip within its well |
| Del | Remove the selected chip |
| Esc | Select the visual (its settings show) |
Text boxes and lists keep their own keys: typing a title never moves a chip.