Visual types
A visual is a VisualDefinition: a model, a type, and fields in its wells. Every type below is offered in the
designer's gallery and drawn by the connector you plug in (LiveCharts2 or OxyPlot), except the KPI, the gauge, the
table, the matrix, the text and the image, which EasyBI draws itself whatever the connector.
new VisualDefinition
{
    Title = "Revenue by region",
    Model = "sales",
    Type = VisualType.Bar,     // (1)!
    Axis = [new("Region")],
    Legend = new("Channel"),   // (2)!
    Values = [new("Amount")],
};
- The type: one of the
VisualTypebelow, or one of your application's. - Optional: splits the values into one series per channel.
Comparison
-
Bars ·
VisualType.Bar
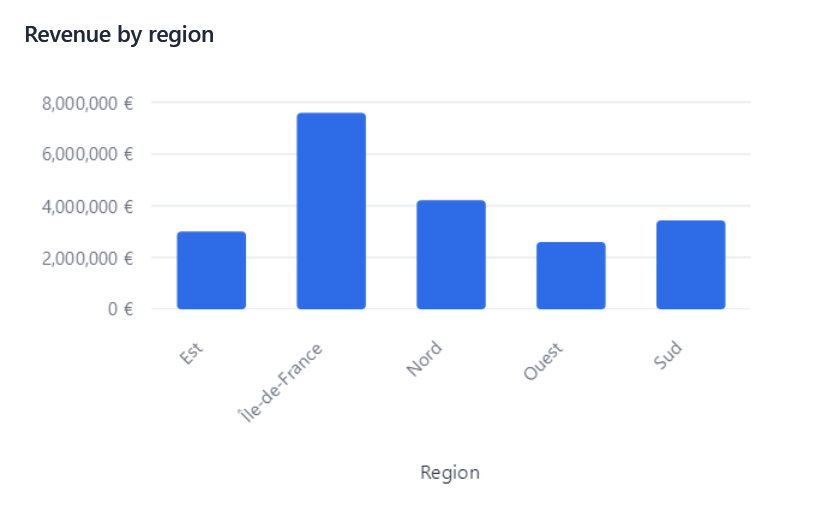
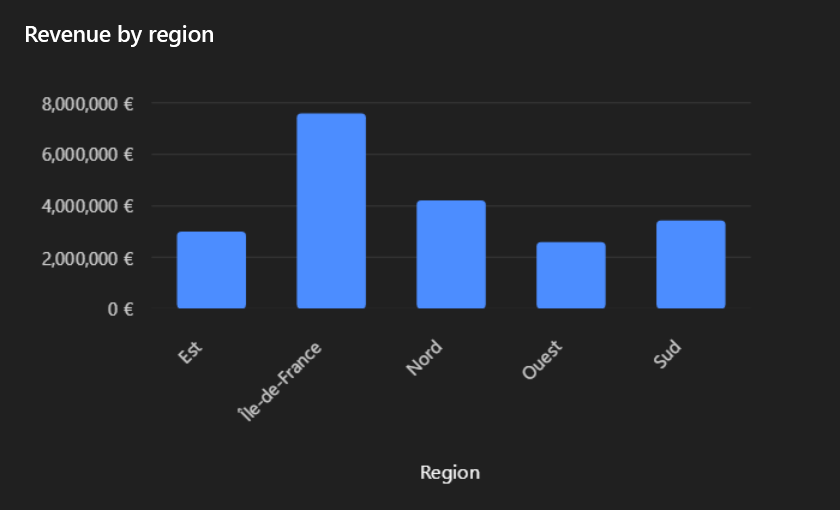
Axis (up to 3 fields), Legend, Values. One bar per category and series.
-
Stacked bars ·
VisualType.StackedBar
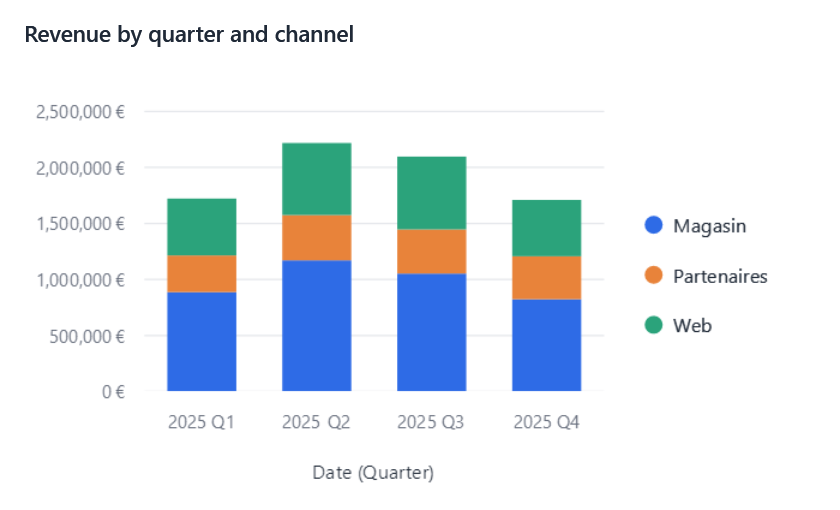
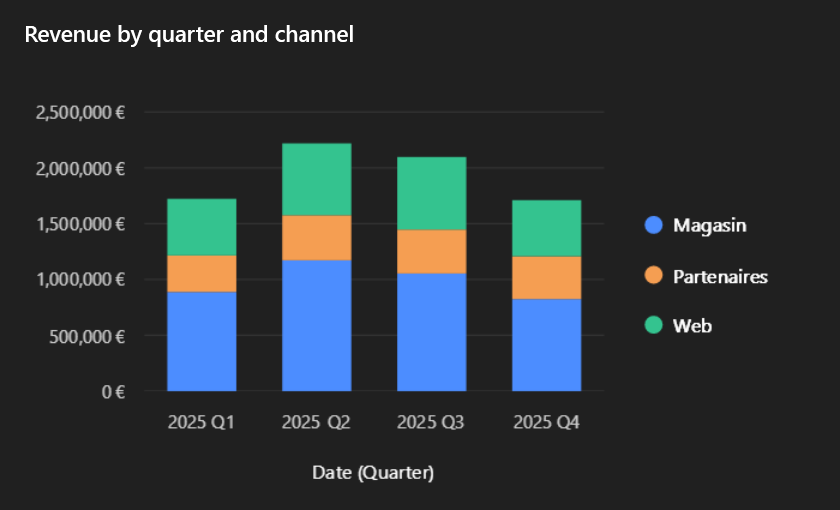
The series of a category piled up: the height is their total.
-
Points ·
VisualType.Scatter
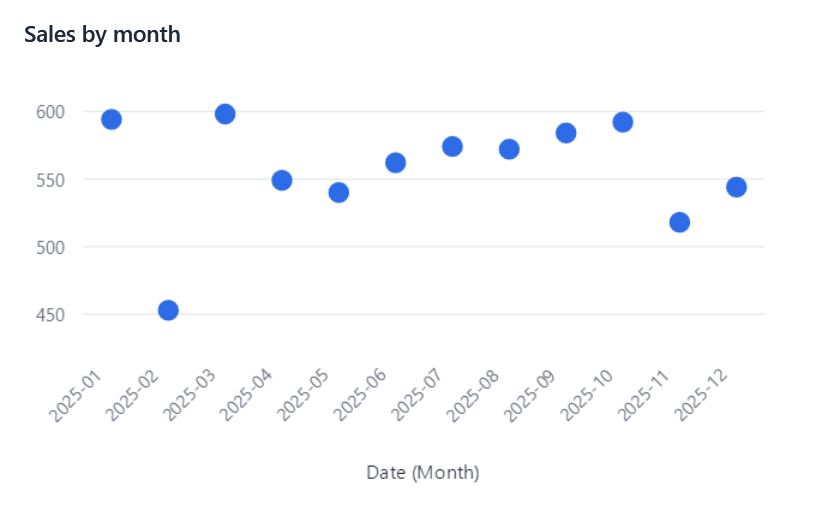
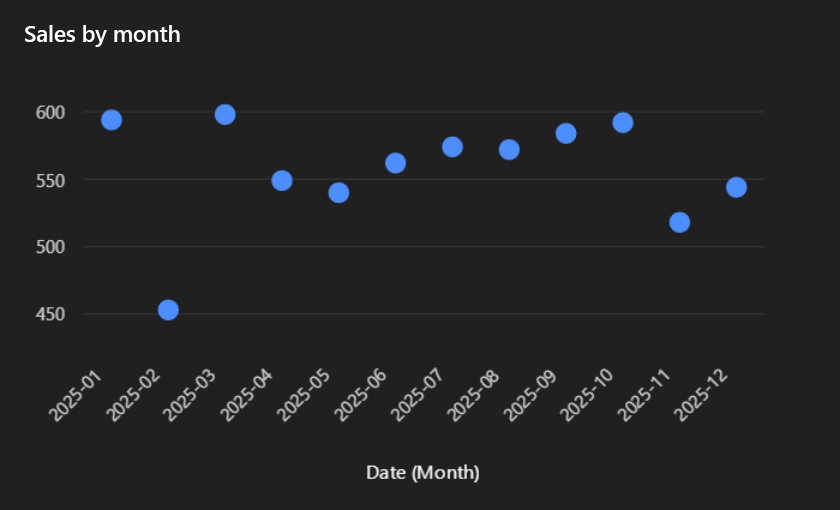
A point per category and series, without a line.
Trend
-
Lines ·
VisualType.Line
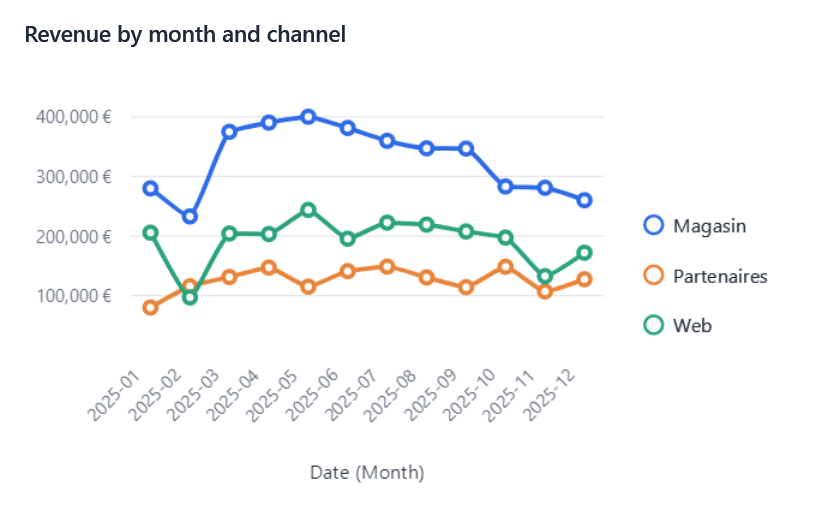
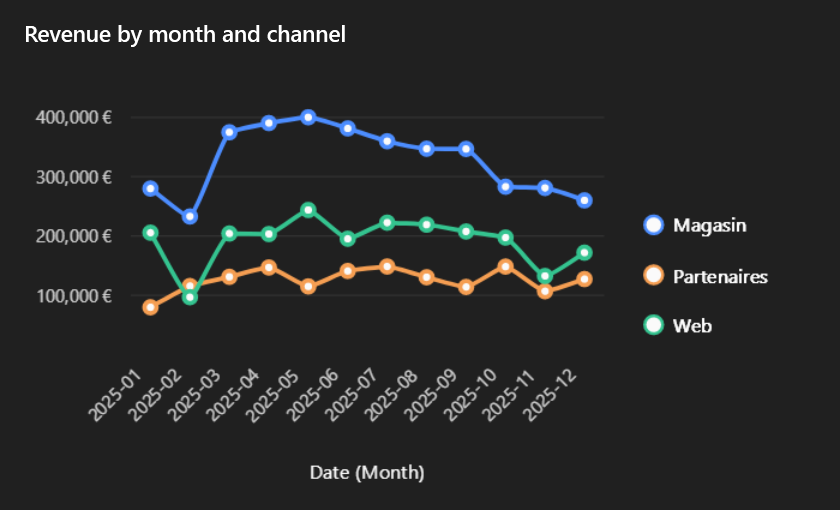
Best with a date on the axis: one line per series.
-
Areas ·
VisualType.Area
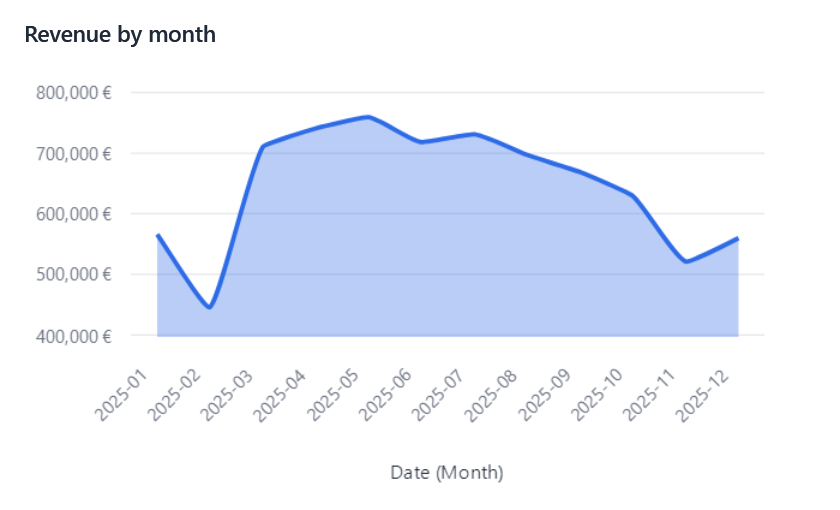
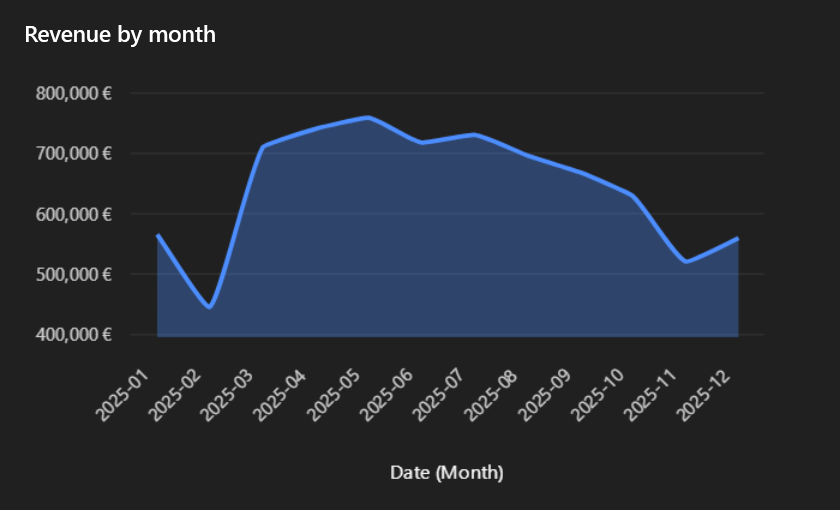
Lines filled down to the axis.
Mix them
The bars, stacked bars, points, lines and areas can be mixed in one chart, one type per measure, with a second value axis: see Combined charts.
Composition
-
Pie ·
VisualType.Pie
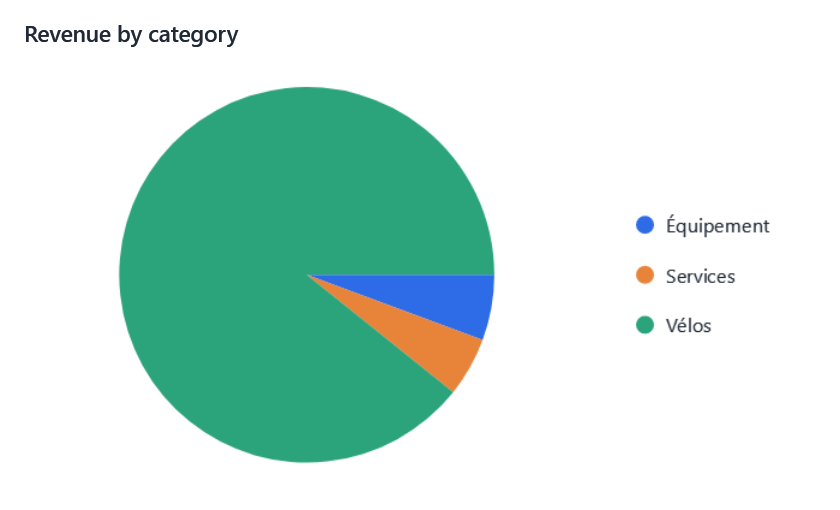
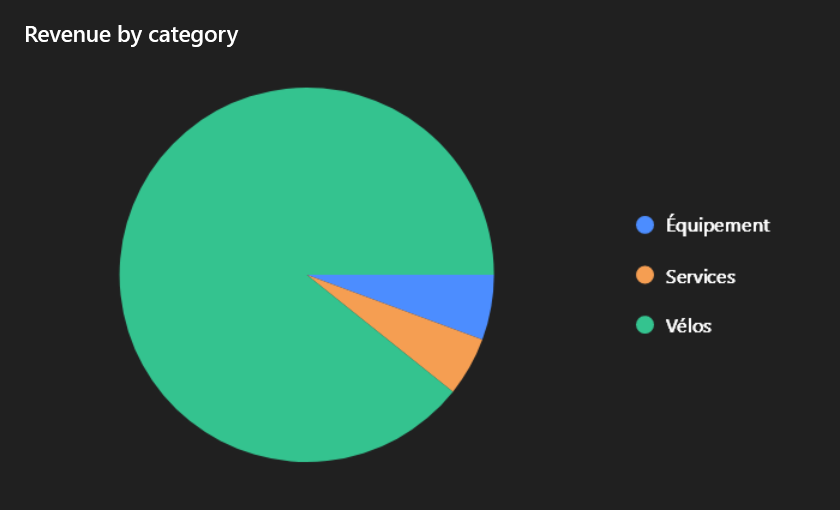
Category (1 field), Value (1 measure).
-
Donut ·
VisualType.Donut
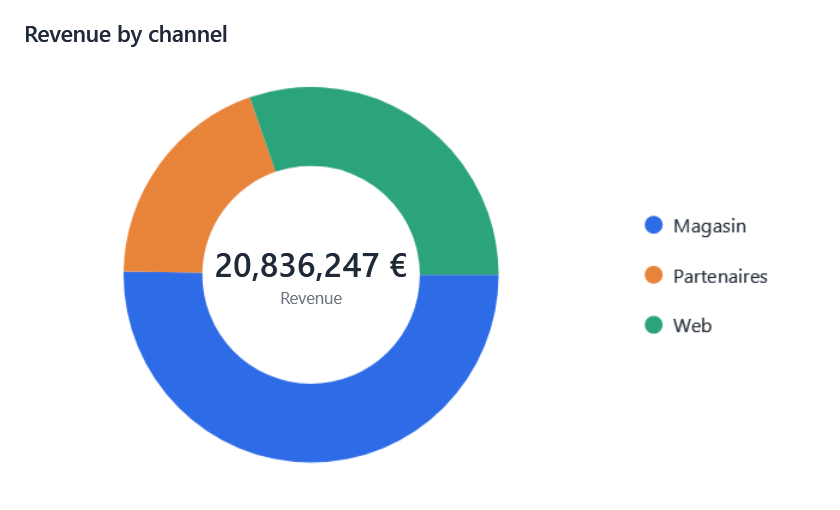
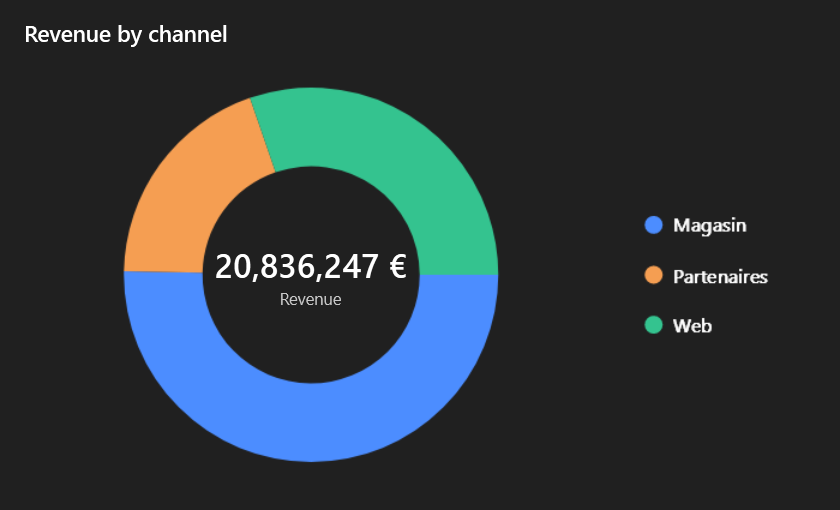
A ring with the total in its hole.
-
Waterfall ·
VisualType.Waterfall
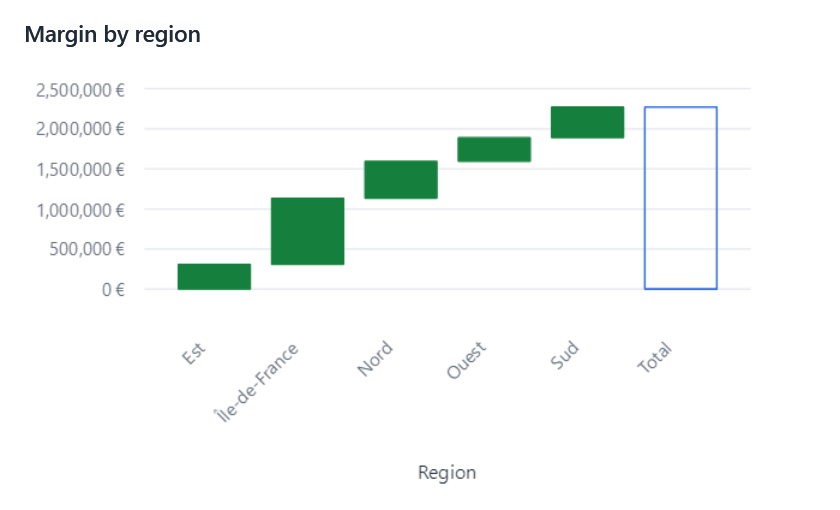
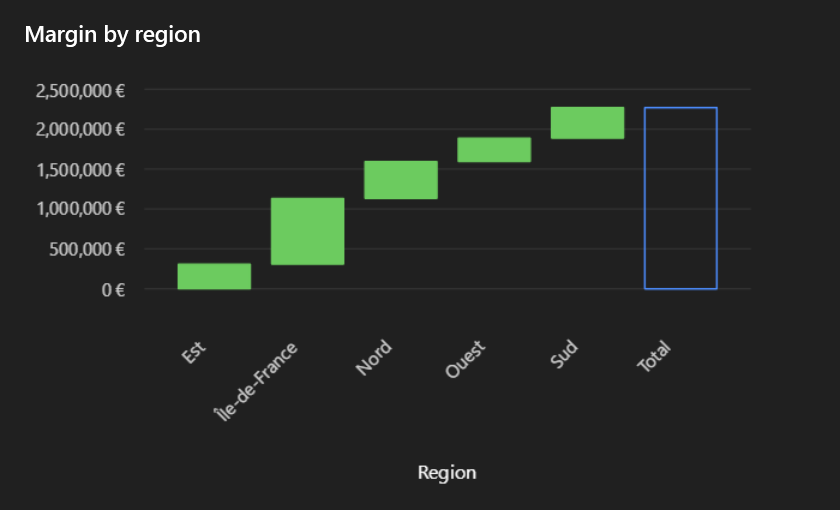
How each category adds to the running total, up in green, down in red, then the total.
Indicators and tables
-
KPI ·
VisualType.Kpi
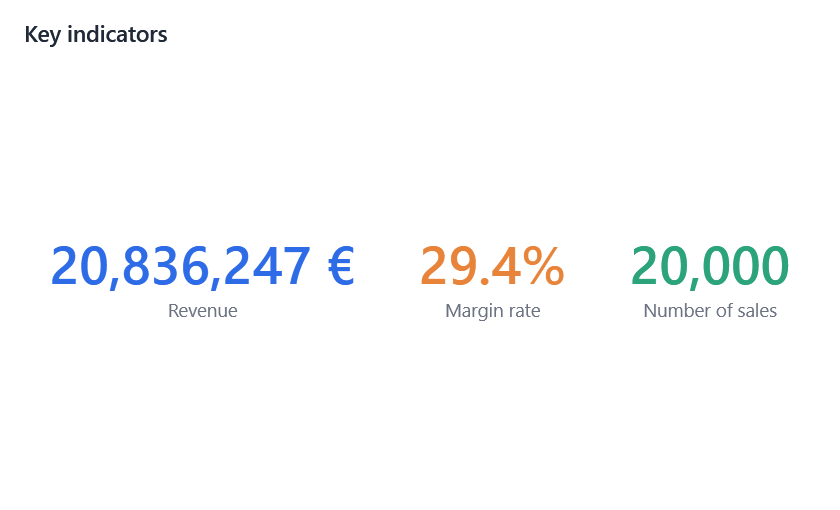
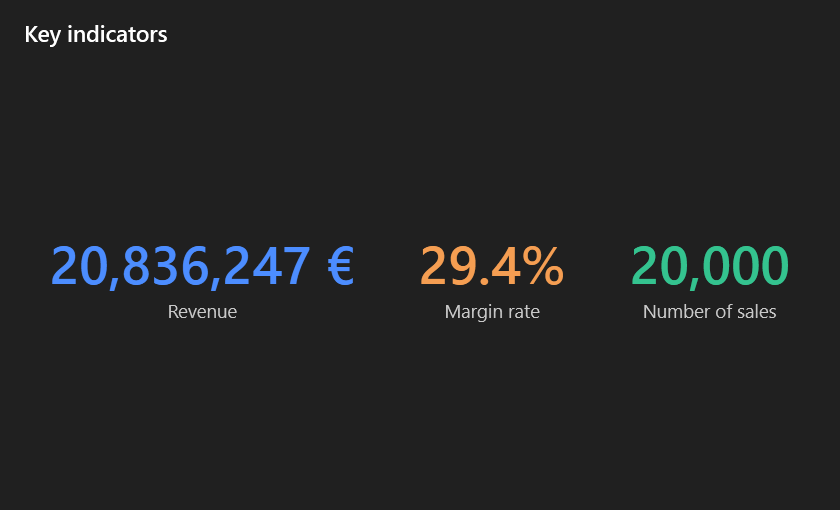
Values only: one big number per measure. Shows ▲ / ▼ for changes over time.
-
Gauge ·
VisualType.Gauge
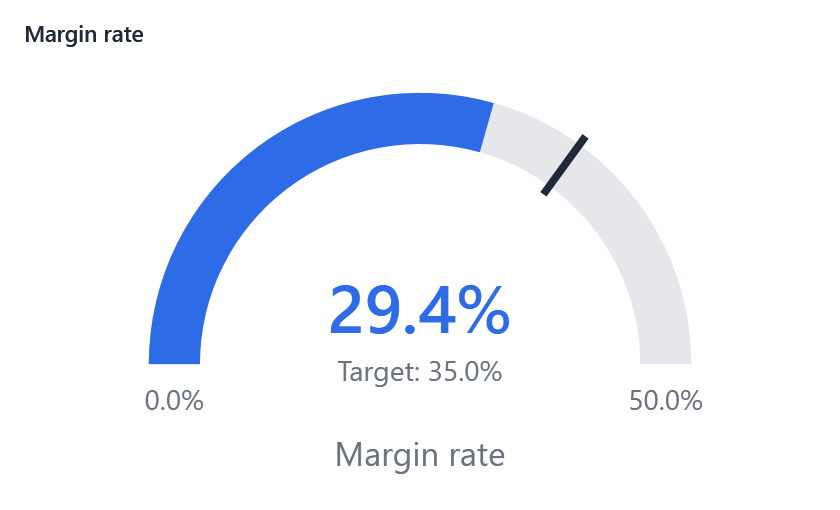
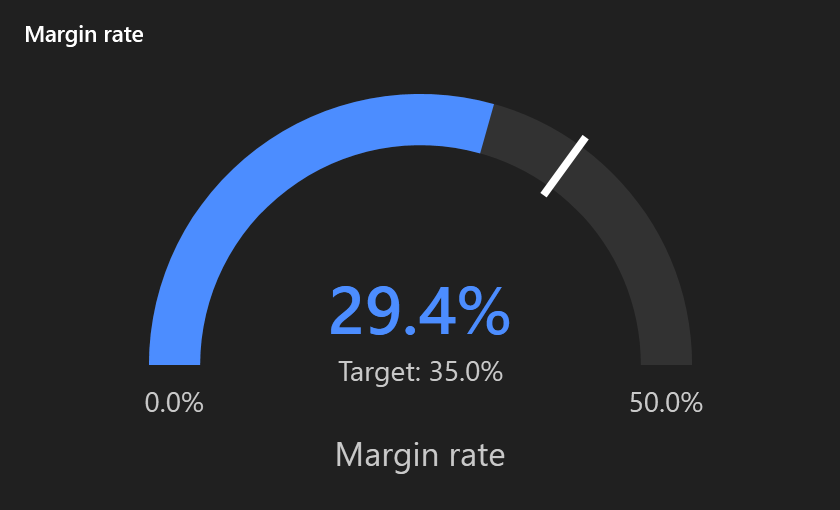
One value on a half circle, with a scale and a target.
-
Table ·
VisualType.Table
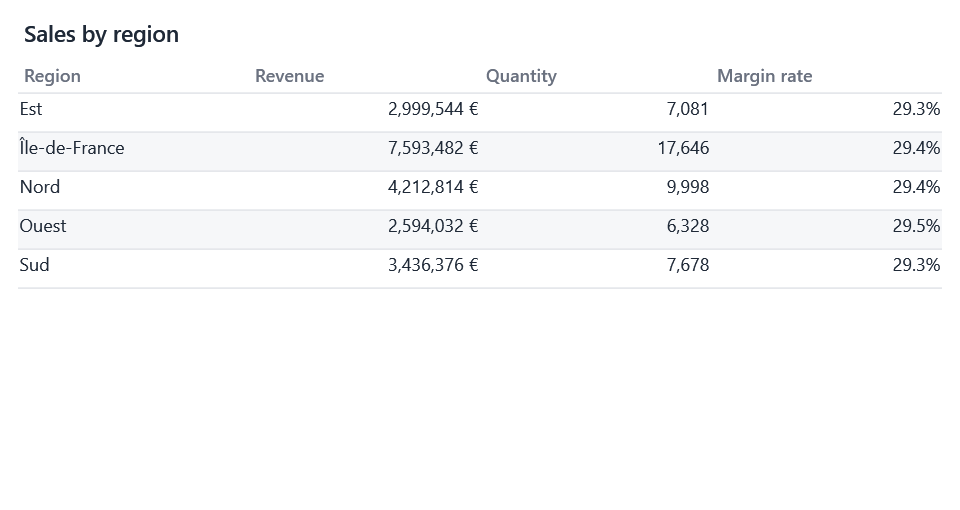
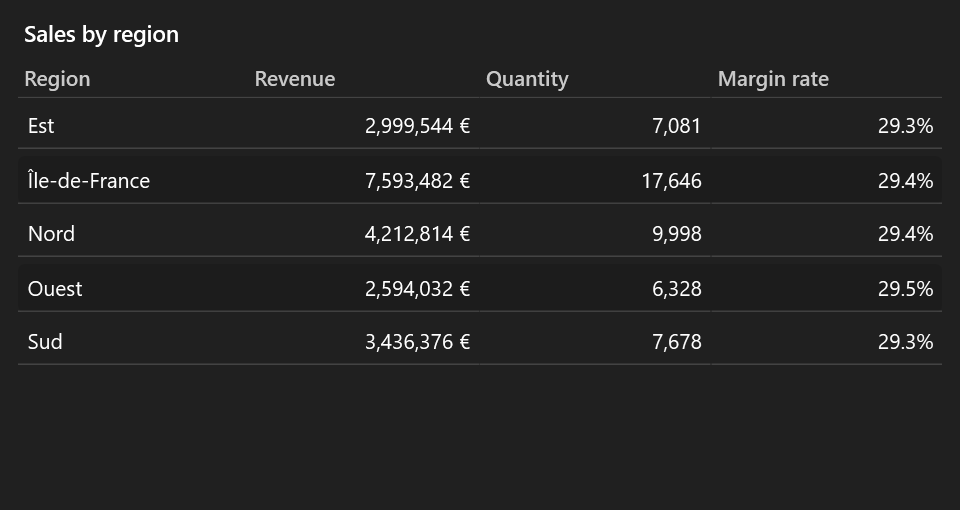
Rows (up to 3 fields), Values.
-
Matrix ·
VisualType.Matrix
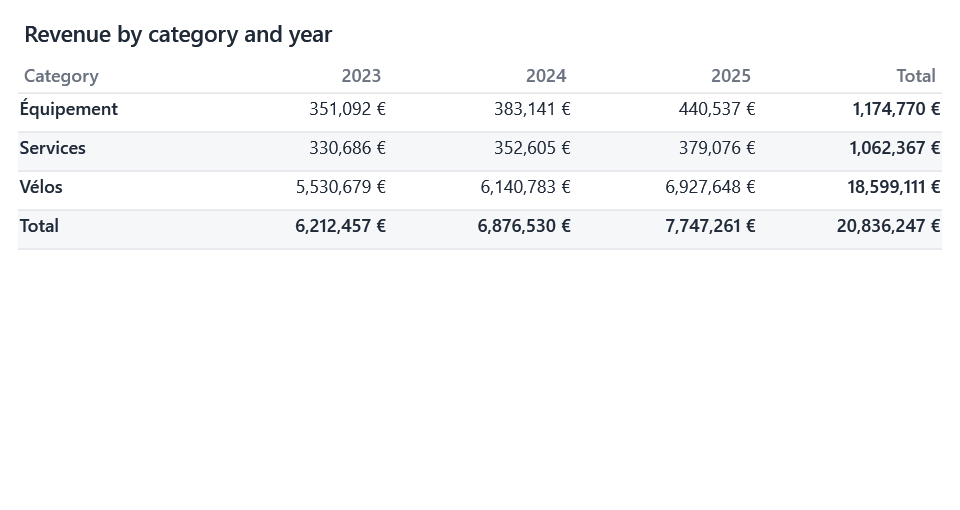
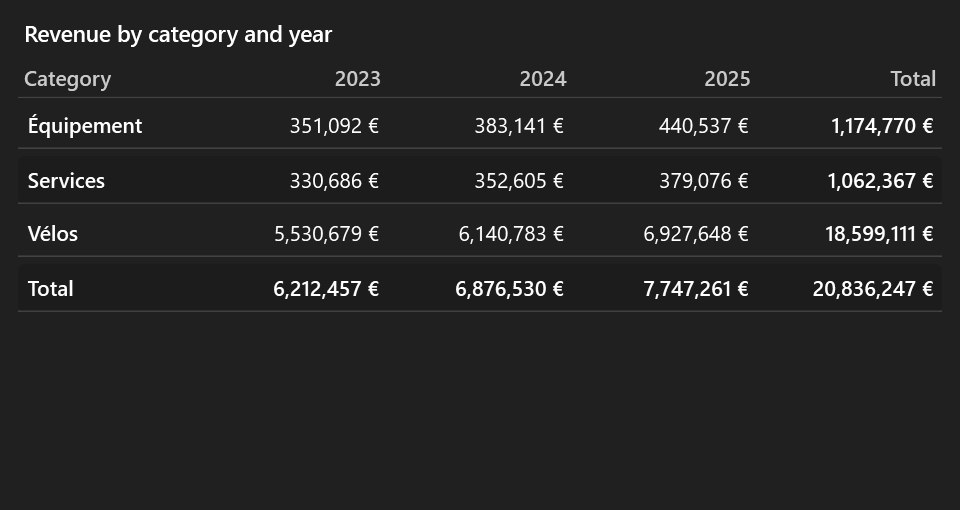
Rows crossed with columns, with totals. See Matrix.
Gauge settings
The scale and the target of a gauge are numbers of the visual, edited in the designer's Visual section:
new VisualDefinition
{
    Model = "sales", Type = VisualType.Gauge, Values = [new("MarginRate")],
    Gauge = new GaugeSettings { Minimum = 0, Maximum = 0.5, Target = 0.35 },
};
| Setting | Empty means |
|---|---|
Minimum |
0 |
Maximum |
A round number above 0, the value and the target |
Target |
No target mark |
The measure's format colors the value and adds its icon.
Content
Texts and images query no model. Users add them to a dashboard and edit them in place.
-
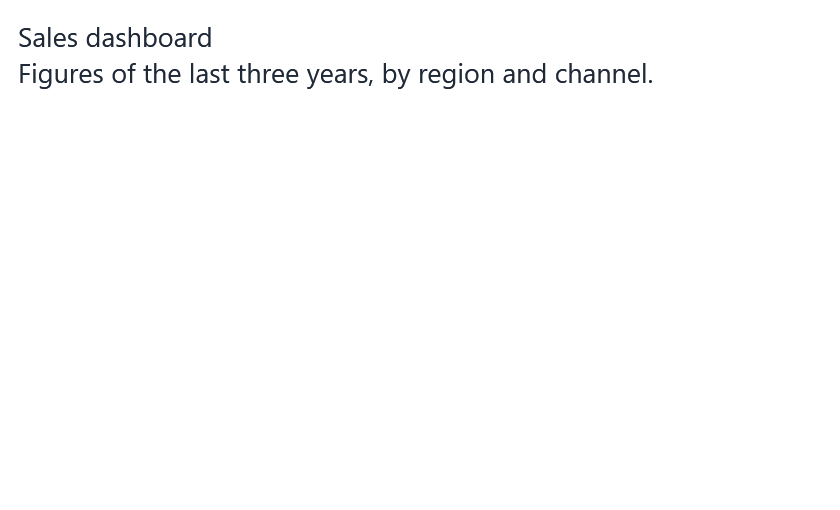
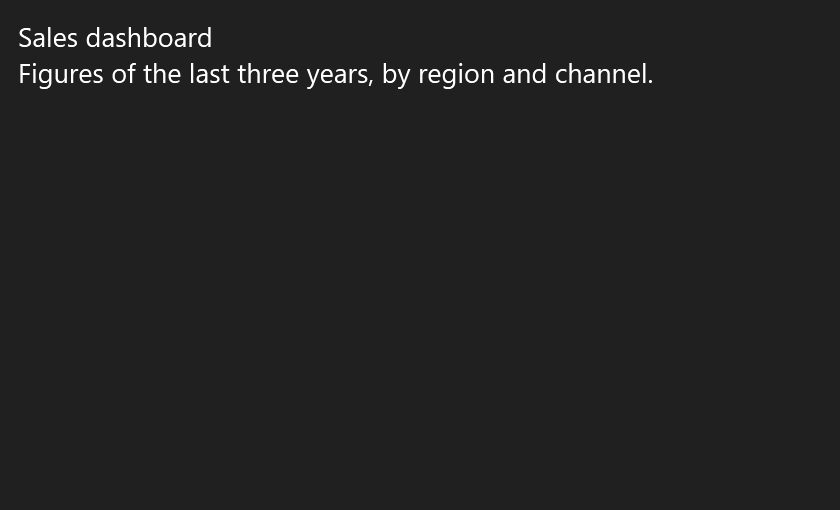
Text ·
VisualType.Text
-
Image ·
VisualType.Image
Embedded in the report, as base64:
Common settings
| Property | |
|---|---|
Title |
Shown above the visual. |
Sort |
A field or measure, ascending or descending: Sort = new("Amount", Descending: true). |
Top |
Keeps the first N categories after sorting. |
Filters |
Filters of this visual only: see Filters. |
LegendPosition |
See Legends. |
Tooltip |
See Tooltips. |
Sort, Top N and filters run inside the query, in the database.