Combined charts
Bars, lines, points and areas in one chart: one type per measure, and a second value axis on the right for a measure of another scale.
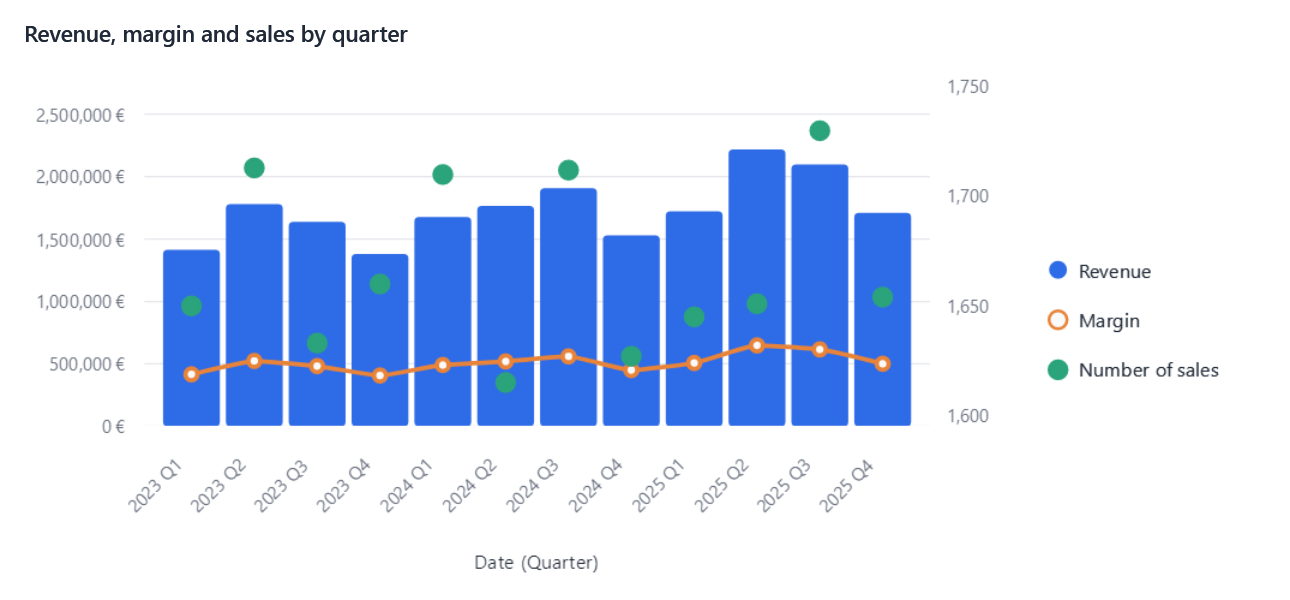
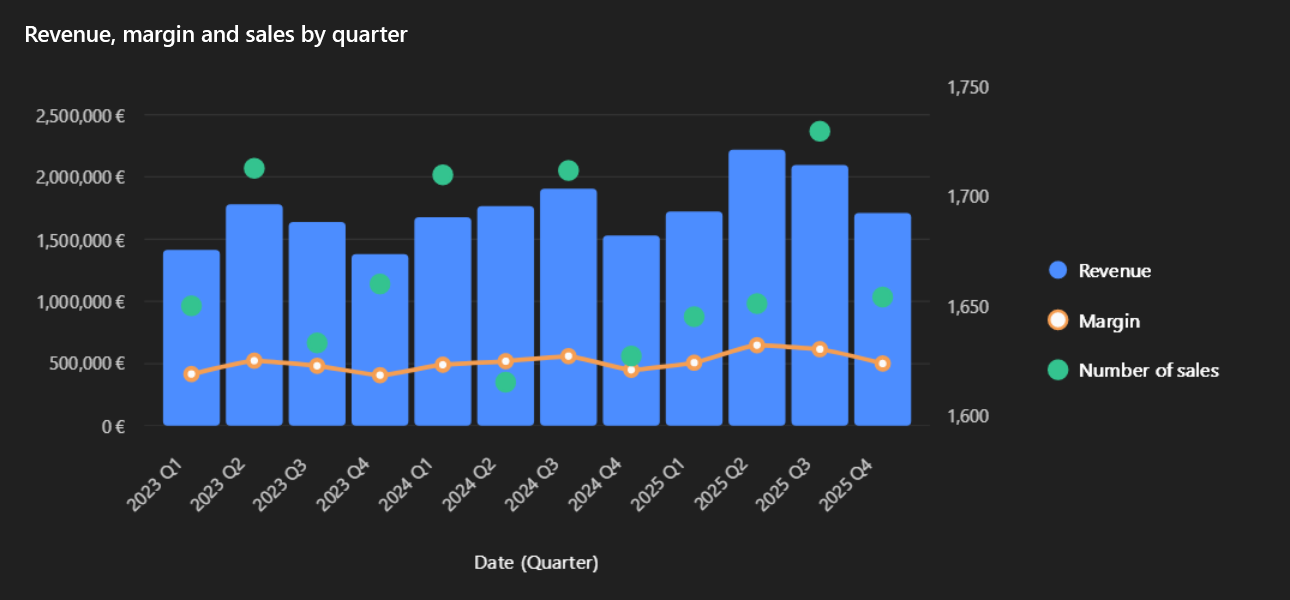
In the designer
Select a measure's chip: its Chart type list overrides the visual's type for that measure, and Secondary axis
moves it to the right axis. The chip shows Y2 when it is on the right axis.
In code
new VisualDefinition
{
    Model = "sales",
    Type = VisualType.Bar,                                        // (1)!
    Axis = [new("Date", DateGrain.Quarter)],
    Values =
    [
        new("Amount"),                                            // bars
        new("Margin") { SeriesType = VisualType.Line },           // a line
        new("Count") { SeriesType = VisualType.Scatter, SecondaryAxis = true }, // (2)!
    ],
};
- The type of the measures that set none.
- Points, against the right axis.
MeasureRef property |
|
|---|---|
SeriesType |
Bar, StackedBar, Line, Area or Scatter; null for the visual's type. |
SecondaryAxis |
Draws the measure against a second value axis, on the right. |
Note
With a legend, every series of a measure keeps the measure's type. These settings only change the drawing: the query is the same, so changing them does not query the source again.