Matrix
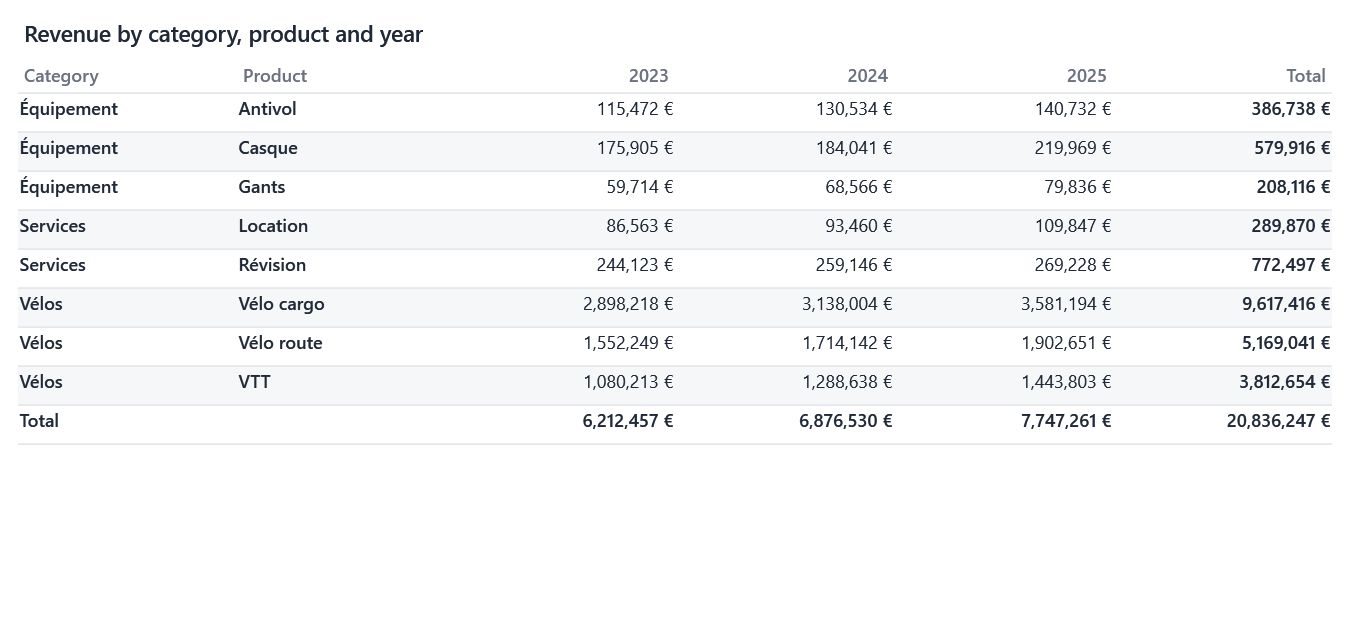
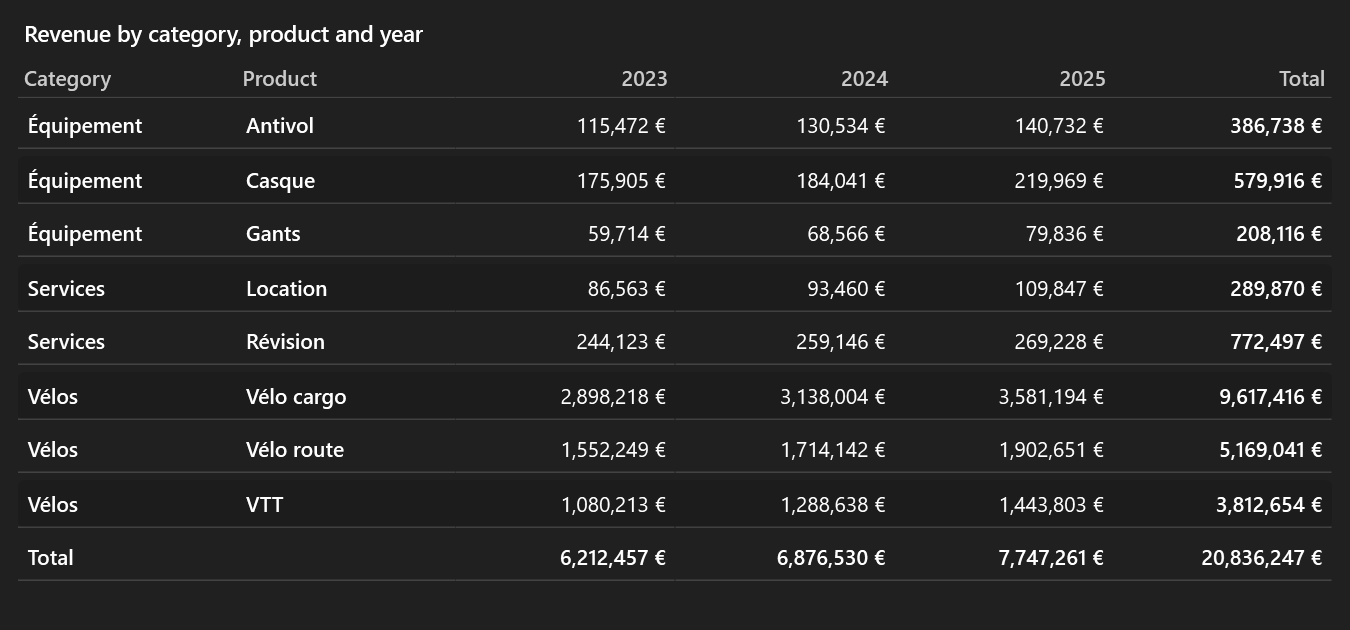
A matrix crosses rows (up to four dimensions) with columns (one dimension), for each measure, and adds the totals of every row, every column and the whole.
Totals that stay right
Each total is the measure computed on all the rows it covers, not a sum of cells: the total of a margin rate is the margin rate of the whole, an average stays an average. EasyBI runs one query per level of totals to get them.
- Sort, Top N and the filters on measures choose the rows; the column totals then count those rows only.
- Without columns, a matrix lists its rows with a total row.
- Conditional formatting applies to the cells, not to the totals.
Interactions
A click cross-filters the other visuals: a cell on its row and column, a row header or total on its row, a column total on its column.
For connector authors
VisualPipeline.PrepareAsync (with MatrixBuilder) hands the pivoted data to the renderer in
RenderRequest.Matrix (MatrixData); a click reports a MatrixSelection. The built-in MatrixRenderer draws it
in a grid styled like the table.