Value labels
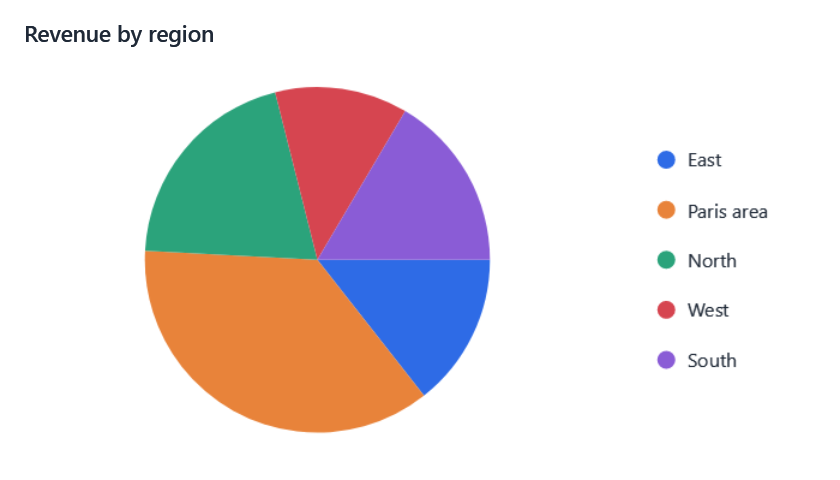
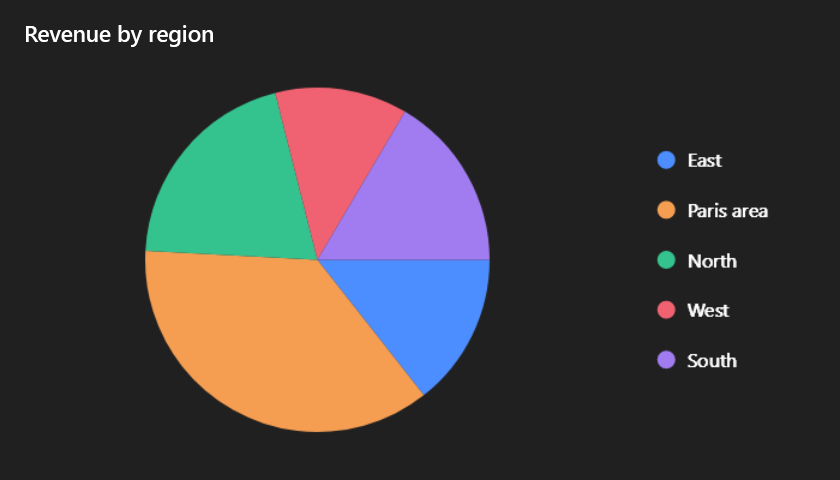
A visual can show its own text for values of a dimension: Paris area for Île-de-France, North for Nord.
In the designer
Select a dimension's chip: the Value labels section lets users pick a value (type to search among many), type its text and add it. Each label can be edited or removed.
In code
Axis =
[
    new("Region") { Labels = new Dictionary<string, string> { ["Île-de-France"] = "Paris area", ["Nord"] = "North" } },
],
Keys are the values' invariant text. field.Display(value) and field.WithLabel(value, text) (EasyBI.Core) read and
set them.
- The labels apply everywhere in the visual: axis, groups, legend, tooltips, tables, matrices, the description of a selection.
- Filters and cross-filtering keep the values themselves: renaming a value never changes what is filtered.
- Dates have none: their periods follow their grain.