Several axis fields
An axis takes up to three fields: year, then region. The chart draws them as a hierarchy, each outer value once, under its group of bars.
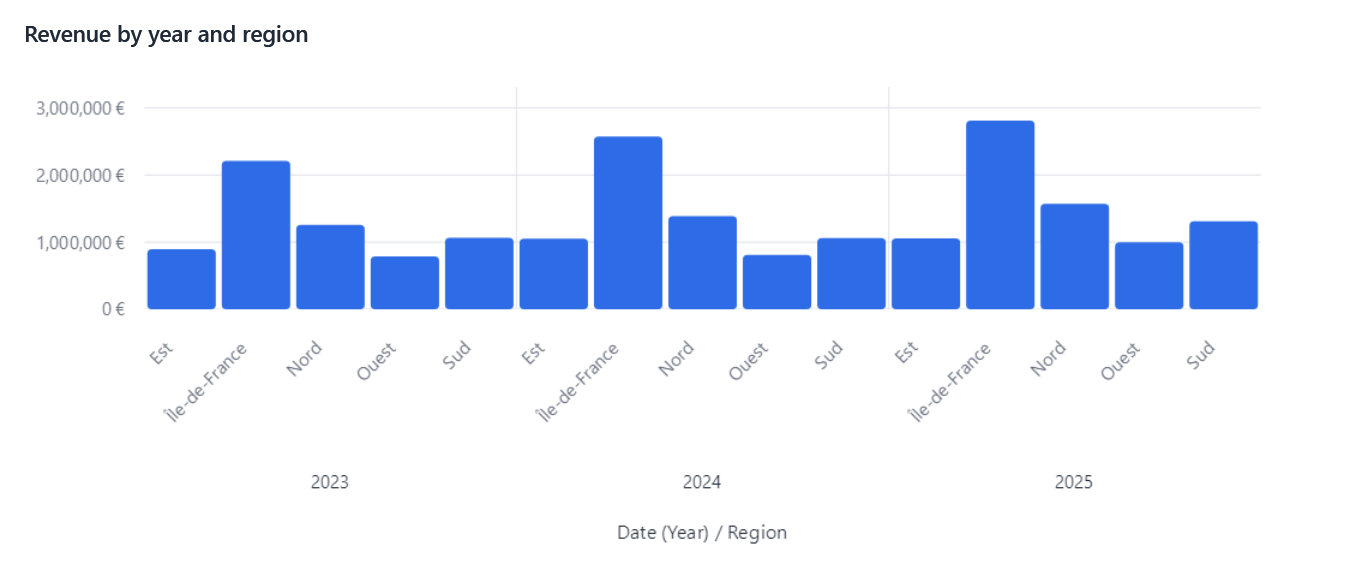
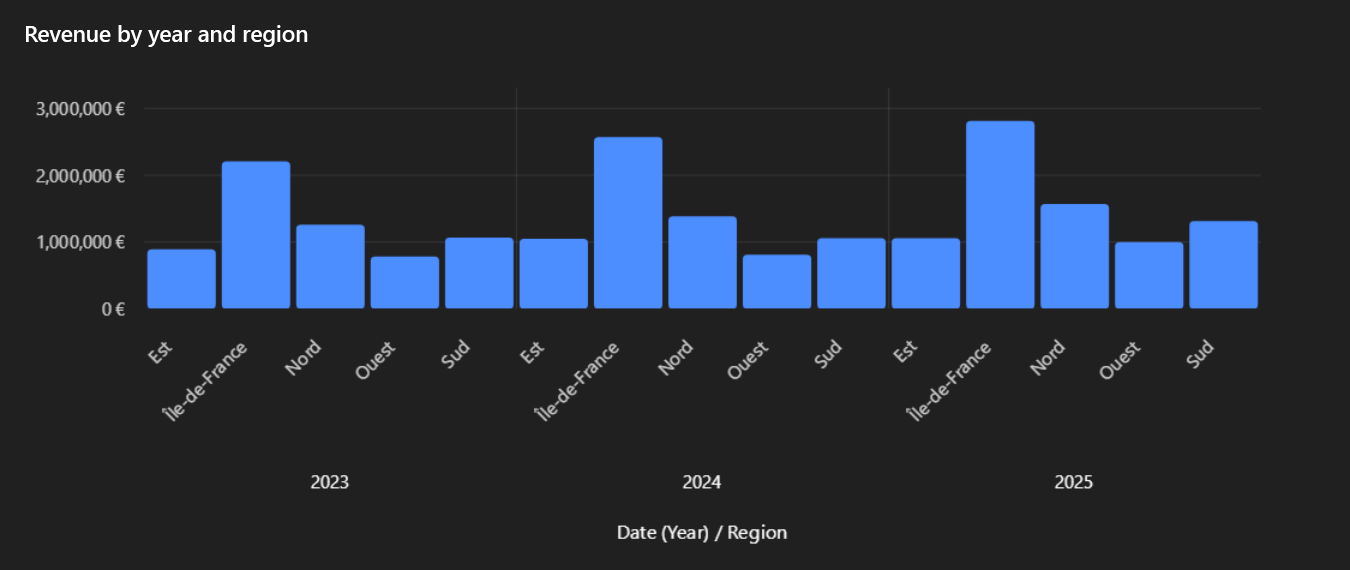
How the labels adapt:
- Each bar is labelled by the innermost field (Nord), each group by the outer one (2024), with a line between the groups.
- When the bars are too narrow, every n-th group label shows, and the innermost labels give way to the groups'.
- Sorted on a measure, the categories are no longer grouped: they keep joined labels (2024 / Nord).
- Tooltips always show the whole category.
For connector authors
CategoryLevels.Of(request.Chart) (EasyBI.Core) gives the short labels and the groups of each outer field
(CategoryGroup: label, first category, count, center). LiveCharts2 draws the groups on extra X axes, OxyPlot on
axes of the next tiers.