Comparisons over time
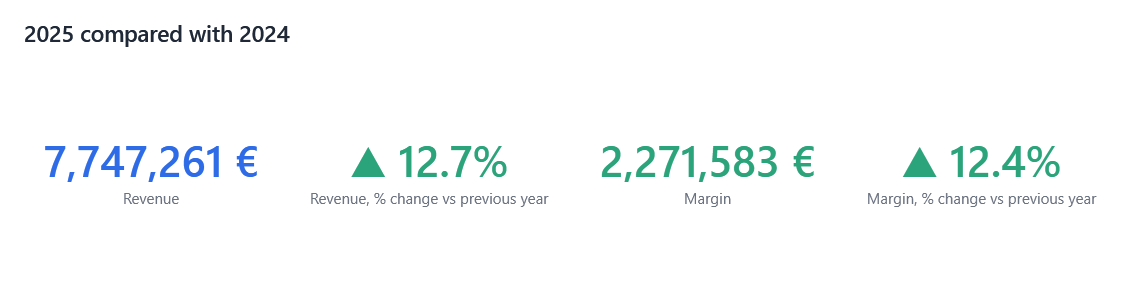
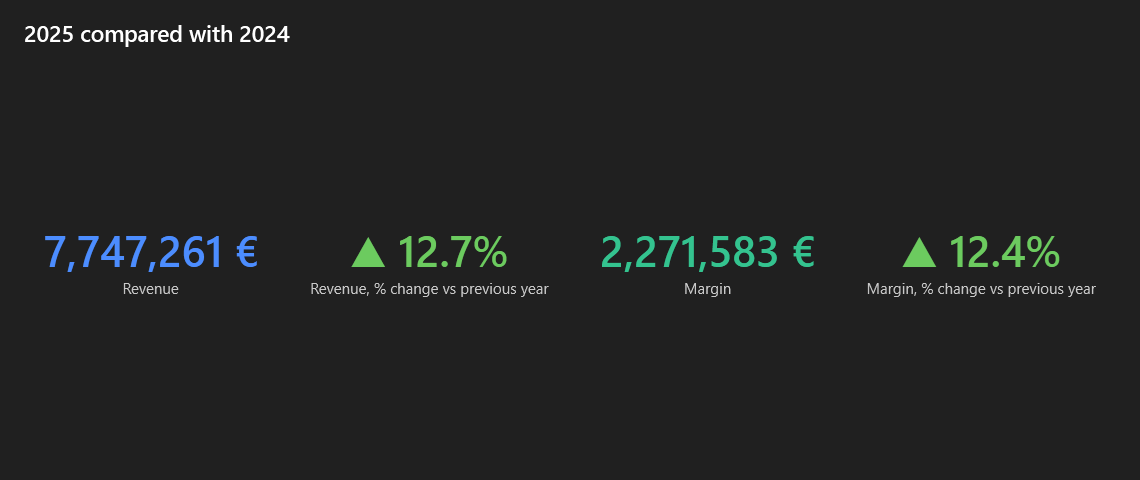
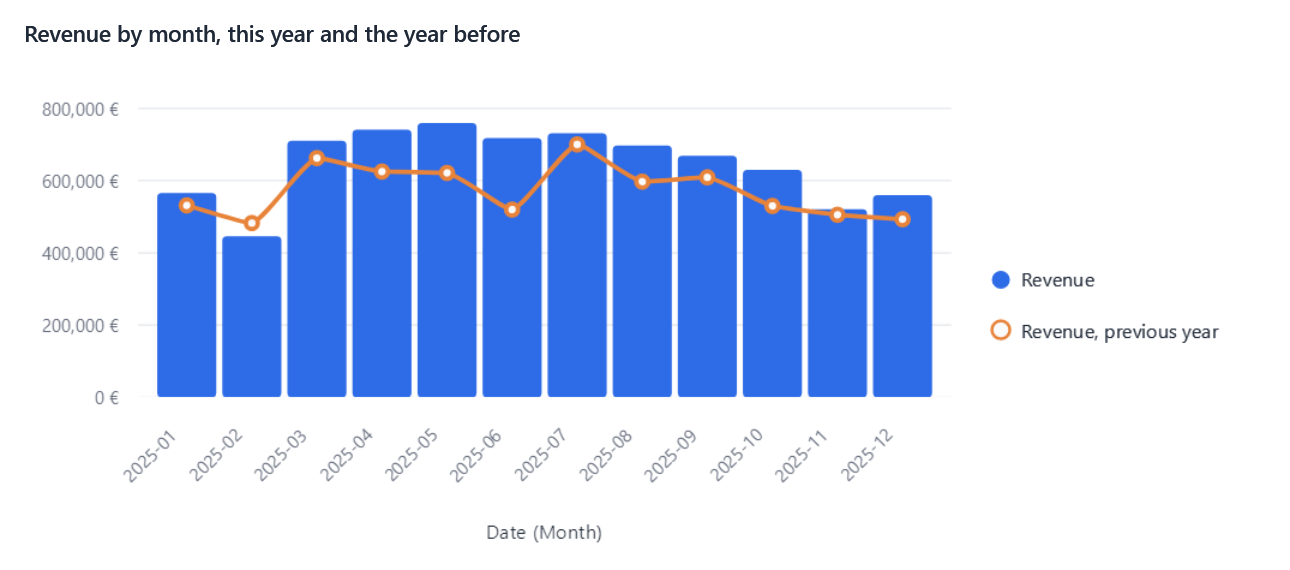
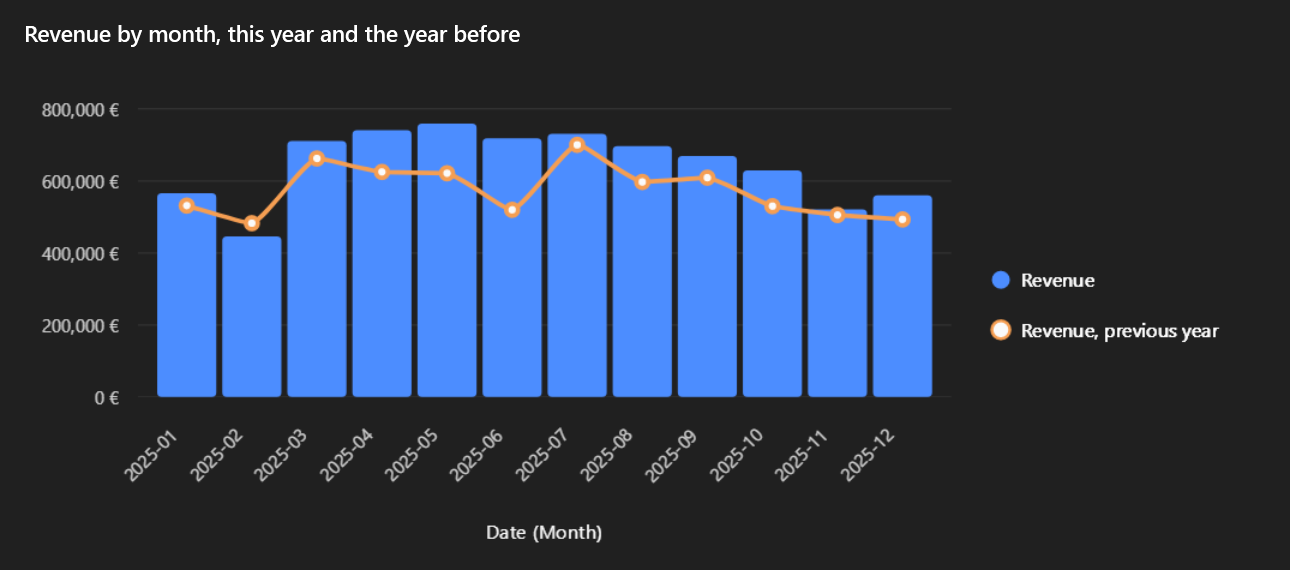
Each measure can be seen through time: its value the year before, the change since, or its total since the start of the year.
In the designer
Select a measure's chip: its Over time list offers the calculations. Drop the same measure twice to show it with and without one, as above.
In code
Values =
[
    new("Amount"),
    new("Amount") { Time = TimeCalculation.PercentChangeFromPreviousYear },
],
Filters = [PeriodFilters.Relative("Date", FilterOperator.Current, DateGrain.Year)],   // this year
TimeCalculation |
Shows |
|---|---|
PreviousYear |
The value a year earlier |
ChangeFromPreviousYear |
The difference with a year earlier |
PercentChangeFromPreviousYear |
The difference in %; a KPI adds ▲ / ▼ |
YearToDate |
The running total since January 1st, along the date axis |
How the previous year is computed
The same query runs a second time with its dates shifted back one year (period filters, clicked periods), and its
groups are matched with the first: each month with the same month a year earlier, per series. It works on any model,
in VisualPipeline.PrepareAsync.
A period under way is compared with the same days
On February 15th, this year is compared with January 1st to February 15th of last year, not with the whole of last year, since there is no data after today. The same goes for the month under way, the last 12 months, or a range ending later.
A date is needed
The calculation needs a date on the axis or a date filter. Without either, it is empty.