Conditional formatting
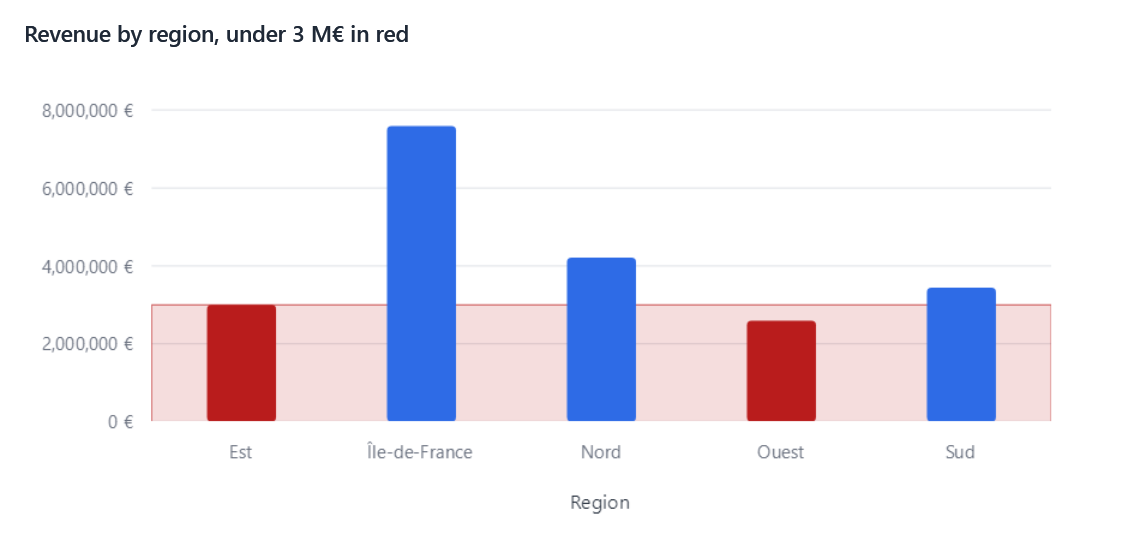
Each measure of a visual can have a format: colors by rules, a color scale, data bars or icons in tables and matrices; colored bars and shaded zones in charts.
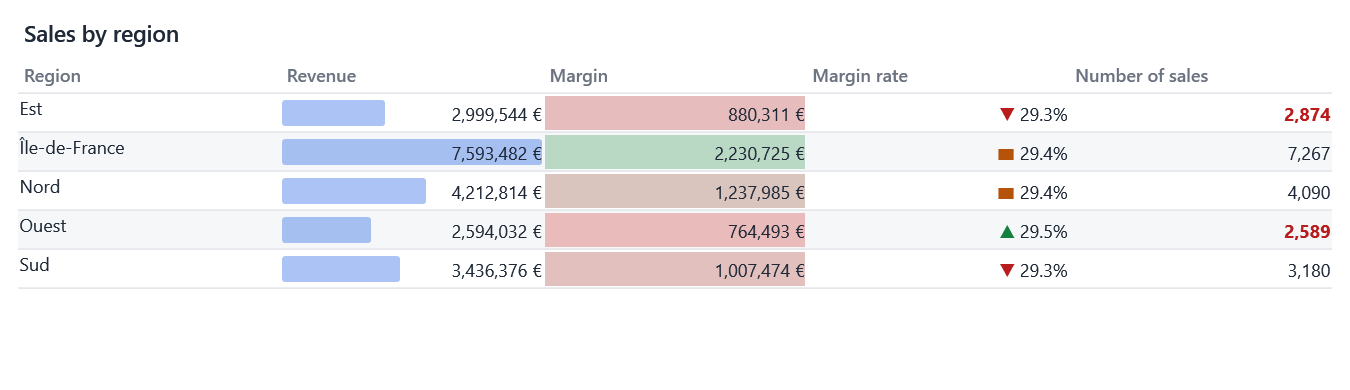
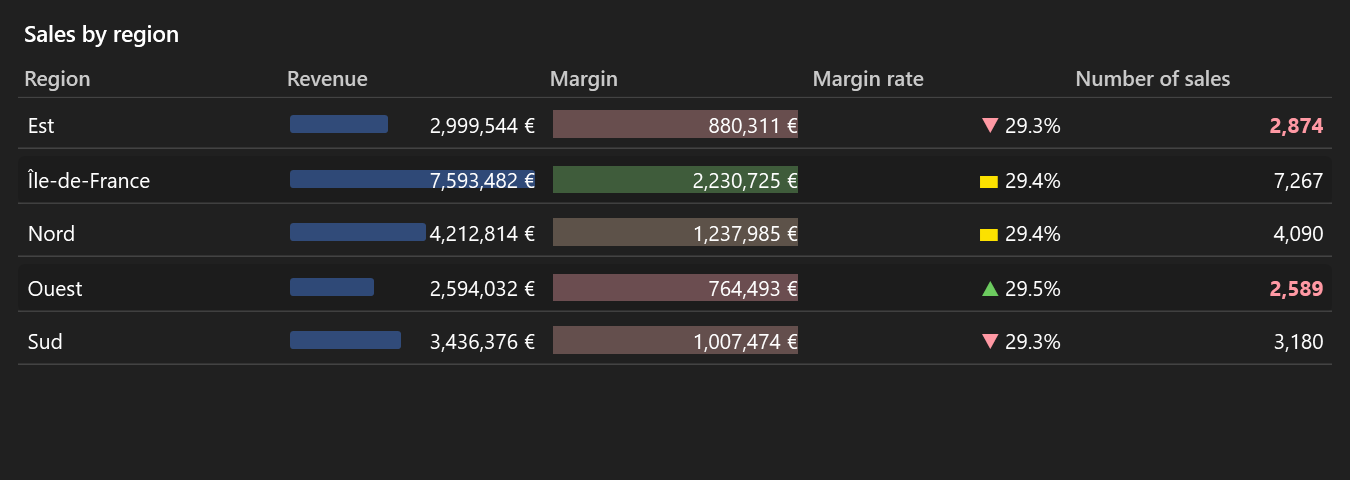
In the designer
Select a measure's chip: the Formatting section edits its format. It only shows what the visual's type uses: on a chart, the rules (with their zone) and the scale; on a KPI, no scale or bars. What it hides is kept.
What a format holds
| Applies to | ValueFormat property |
|
|---|---|---|
| Fixed style: text color, bold, italic, alignment | Tables, matrices, KPIs | Color, IsBold, ... |
| Rules: the first matching one gives its color, background and weight | Everywhere | Rules |
| Color scale: a background from one color to another, between the smallest and the largest value | Tables, matrices, charts | Scale |
| Data bars: a bar as long as the value compared with the largest | Tables, matrices | Bar |
| Icons: arrows, triangles or circles for high, middle and low values | Tables, matrices, KPIs, gauges | Icons |
new MeasureRef("Amount")
{
    Format = new ValueFormat
    {
        Rules =
        [
            new FormatRule { Operator = FilterOperator.LessThan, Value = 1000, Color = ThemeColors.Error, IsBold = true },
        ],
        Bar = new DataBar(),
        Icons = new IconSet { Kind = IconKind.Triangles }, // (1)!
    },
};
- Without thresholds (
Low,High), the values are split in thirds.
A rule's comparison is the one of numeric filters: GreaterThan, LessThan, Range...
Colors
Colors are the theme's: ThemeColors.Accent, Success, Warning, Error, Muted. They follow light and dark themes
and the control library, and are softened as backgrounds so that values stay readable. A custom #RRGGBB works too.
In charts
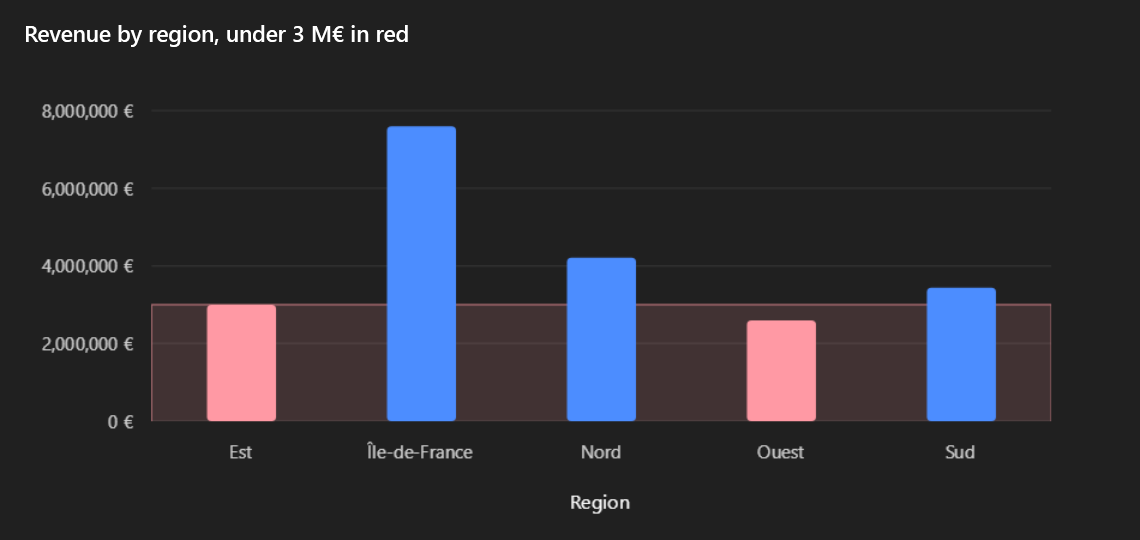
Rules and the color scale color each bar, point and slice. A rule with Show its zone on charts
(FormatRule.ShowOnChart) also shades its zone of the value axis, labelled with its condition.
- Stacked bars are judged as a whole: a rule or a scale compares the total of the stack, and frames the stack in its color, so that the series keep their legend colors.
- OxyPlot colors bars and slices one by one, but the points of lines by series only.
Compared with what is shown
The scale, the bars and the automatic thresholds compare a value with the cells shown, not with the totals. A matrix leaves its totals unformatted. A format only changes the drawing: the source is not queried again.
For connector and application authors
ValueStyler (Core) computes the ValueStyle of a value for any renderer, and the lookless FormattedValue
control draws it in the built-in grids. ChartFormatting.For(request) gives a connector the color of each point
(PointColor) and the zones (Bands); each ChartSeries carries the MeasureKey of its measure. LiveCharts2
uses OnPointMeasured and RectangularSection, OxyPlot RectangleAnnotation.